Read our blogs, tips and tutorials
Try our exercises or test your skills
Watch our tutorial videos or shorts
Take a self-paced course
Read our recent newsletters
License our courseware
Book expert consultancy
Buy our publications
Get help in using our site
453 attributed reviews in the last 3 years
Refreshingly small course sizes
Outstandingly good courseware
Whizzy online classrooms
Wise Owl trainers only (no freelancers)
Almost no cancellations
We have genuine integrity
We invoice after training
Review 30+ years of Wise Owl
View our top 100 clients
Search our website
We also send out useful tips in a monthly email newsletter ...
Power BI Desktop updates for September 2025 Part two of a four-part series of blogs |
---|
The big changes in this month's update are two preview features which will change the working lives of DAX authors when released: a new way of creating calendars and the ability to write functions in DAX.
|
In this blog
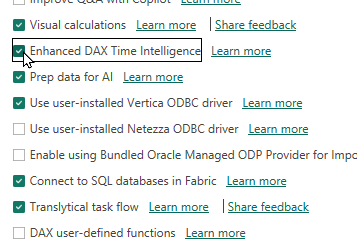
Enhanced DAX time intelligence will make it much easier for organisations having non-standard calendars (ie just about everyone) to create reports using Power BI, and also adds in the ability to work with weeks. To use this new preview feature you must first enable it:
Enhanced DAX time intelligence is a preview feature which is not enabled by default (you can get to this dialog box by choosing File -> Options and settings from the menu,then clicking on the Options and then Preview features tabs).
To use enhanced DAX time intelligence you must first create a suitable calendar, assigning to each date the year, quarter, month, week (!) and day to which it belongs:
The date shown is in 2025, but because we're assuming our calendar year runs from the start of April to the end of March it is in the Wise Owl calendar year 2024/25 (and Wise Owl week number 40).
You can now load this calendar into Power BI in the usual way.
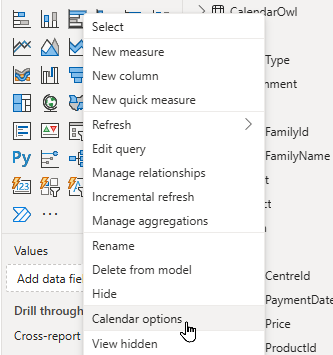
I really like the simple way Microsoft have implemented this - it feels like a feature which won't stay long in preview. First right-click on your calendar and choose the new Calendar options short-cut menu option:
This option will only appear if you have enabled this feature in preview.
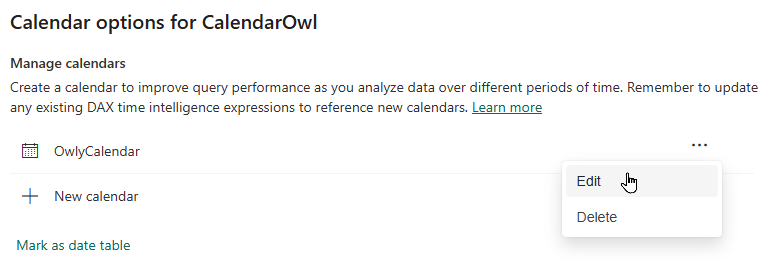
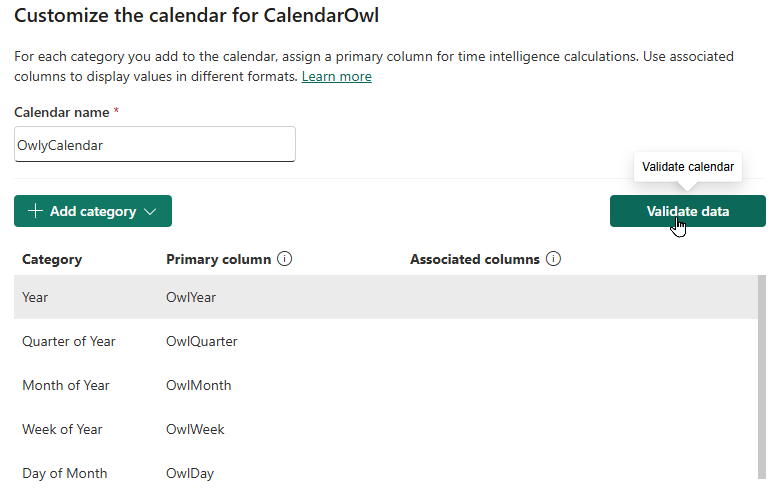
You can now either add a new calendar (I've already done this previously) or edit an existing one:
I'd previously clicked on the New calendar option to add a calendar, and now want to go back in and edit my OwlyCalendar.
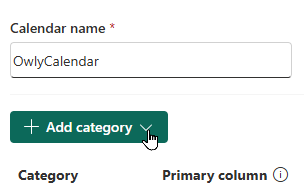
You can then add all the category fields you want (typically you'll have at least year, quarter, month and day):
Click to add each category field.
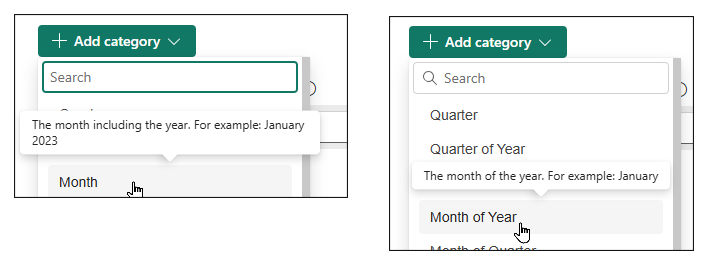
Be very careful to check what you're adding! For example for the month there are two options:
The month on the left would include the year name, so for our example we want the month on the right.
When you have finished making your choices, validate them:
Click on the button shown to check your choices are valid.
If validation errors show up against any category it's probably because you've chosen the wrong option. For my example I initially chose Quarter, Month, etc rather than Quarter of Year, Month of Year, etc, and it took me a while to work out my mistake.
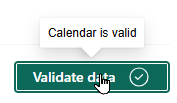
You should eventually get this message:
Yeah!
At this point you can save and close your calendar.
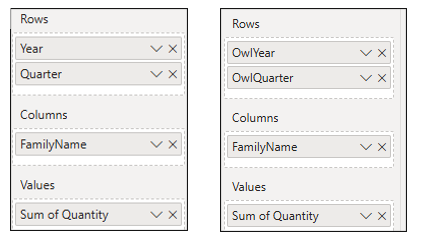
I created two matrices - one using the normal calendar fields, and one using the owly ones:
The matrix on the left uses the default categories, the matrix on the right uses the ones I defined.
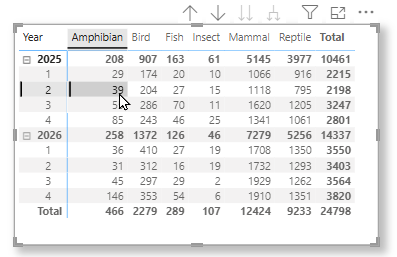
Here's what the standard matrix looks like:
The figure of 39 shows total sales for amphibians for quarter 2 in 2025 (ie from April to June 2025).
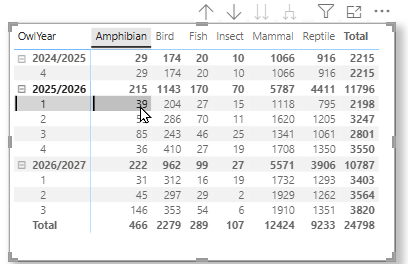
By contrast, here is what the matrix looks like using the Wise Owl calendar fields:
The figure 39 still appears, but it's now quarter 1 in the 2025/26 financial year.
This will make many people's lives MUCH easier!
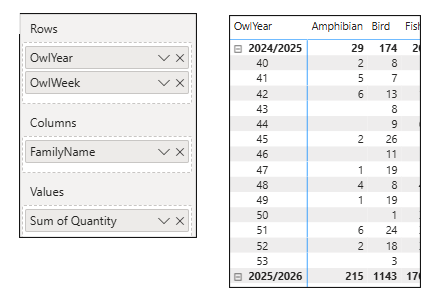
Power BI has never allowed that a week is a reporting time unit - until now:
This matrix reports on data by Wise Owl week number.
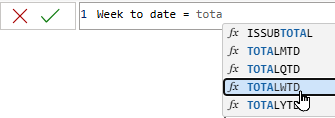
DAX now has week functions to go with year, quarter and month ones:
The function giving the total week to date.
So for example you could create this measure in DAX:
Week to date = TOTALWTD(
// show the total sales for the week to date
SUM(Sales[Quantity]),
'OwlyCalendar'
)
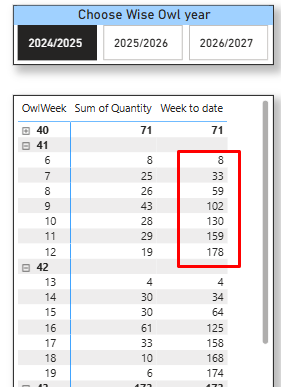
You could then use this to create visuals like this:
You can see the week-to-date figures for this Wise Owl year and week.
Another very welcome addition to Power BI! Kudos to Microsoft for getting this change just right.
Parts of this blog |
---|
|
Some other pages relevant to the above blogs include:
Kingsmoor House
Railway Street
GLOSSOP
SK13 2AA
Landmark Offices
99 Bishopsgate
LONDON
EC2M 3XD
Holiday Inn
25 Aytoun Street
MANCHESTER
M1 3AE
© Wise Owl Business Solutions Ltd 2025. All Rights Reserved.