Read our blogs, tips and tutorials
Try our exercises or test your skills
Watch our tutorial videos or shorts
Take a self-paced course
Read our recent newsletters
License our courseware
Book expert consultancy
Buy our publications
Get help in using our site
431 attributed reviews in the last 3 years
Refreshingly small course sizes
Outstandingly good courseware
Whizzy online classrooms
Wise Owl trainers only (no freelancers)
Almost no cancellations
We have genuine integrity
We invoice after training
Review 30+ years of Wise Owl
View our top 100 clients
Search our website
We also send out useful tips in a monthly email newsletter ...
| Azure Maps for Power BI: Bubble Layer and Reference layer Filled Map Explained |
|---|
| With the departure of Filled maps from Power BI it is time to explore using Azure reference layers. Tom Tom can't picture UK regions so we need to help it by using Spatial map files as a layer. |
In this blog
A delegate recently reached out with a query: How do I add UK regions and overlay bubbles in Power BI?

Using the Reference layer option in Azure Maps, we can achieve the desired effect.
The first thing we need is data that contains postcodes for the bubble locations and regional sales for the filled map gradient.

The RegionId will be used to link the shapefile to the data model.
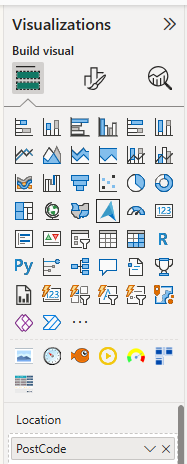
From the Visualizations pane, choose the Azure Maps visual and add your PostCode field into the Location field.

Azure Maps is represented by the blue arrow icon.
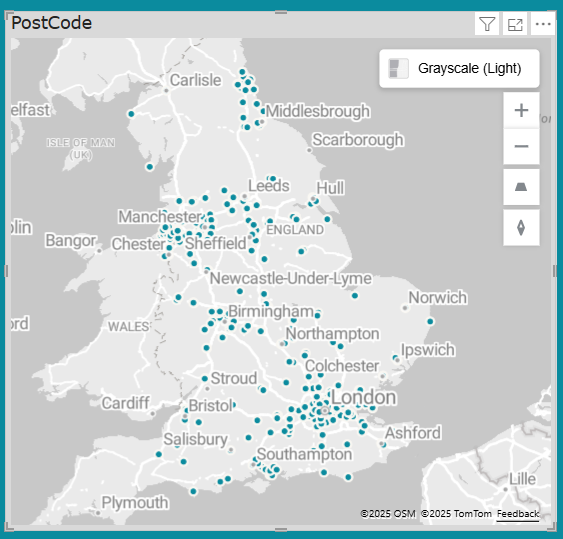
Your map should now display bubbles, one for each PostCode in the data.

I can't tell which region these centres fall under.
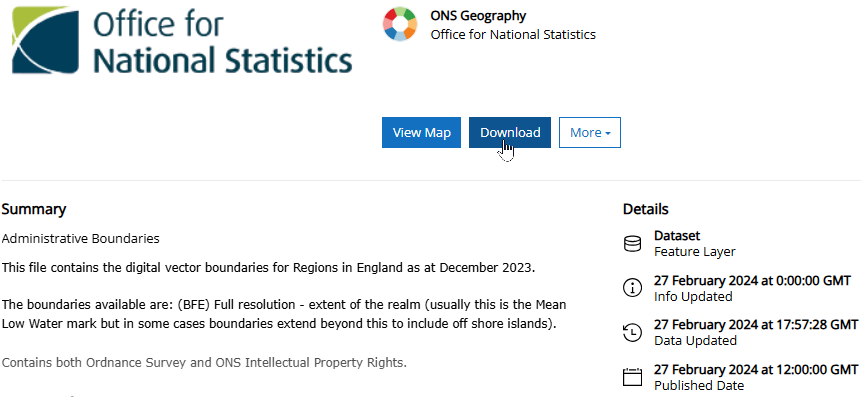
In the UK, the Office for National Statistics (ONS) provides extensive location data, including definitions of the UK Regions.

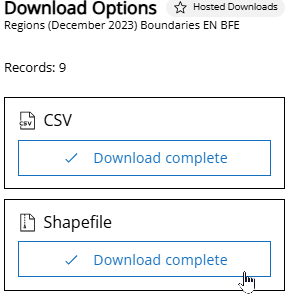
Click on Download to access the available data.
This map is in two parts: a CSV file containing the data we will link to and a Shapefile with the polygons representing each region.

Download both of the files.
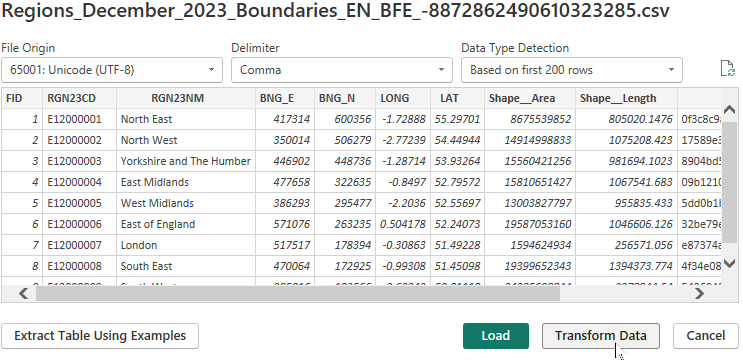
Inside the CSV file, you’ll find several values including a region code (RGN23CD) and a region name (RGN23NM).

These values correspond to each polygon in the shapefile.
To link your sales data with the shapefile, you need a common field.
If the region names match, you can use those. Mine don't so instead, I can manually add a RegionId next to each region.

These RegionIds match the ones in the original file mentioned earlier.
Now we are ready to add the CSV file into our Power BI report.
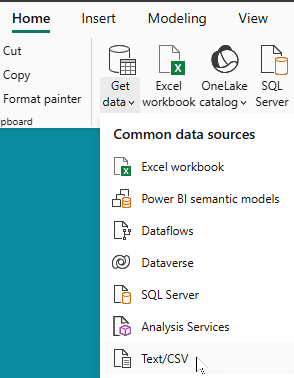
From the ribbon choose Home | Get data | Text/CSV to connect to the file.

Your data does not have to be in a CSV format.
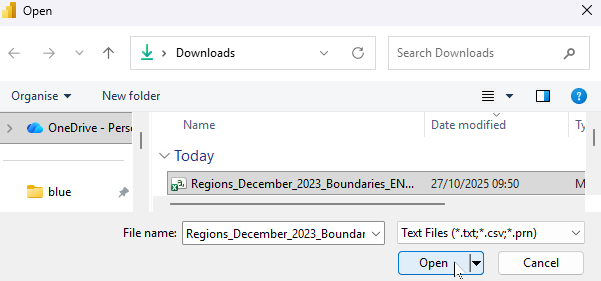
Navigate to where you saved the modified file and click Open.

Consider renaming the file to something less wordy.
Before adding this to the model, we need to add an extra column to link the data sets.

Click Transform Data to open the Power Query Editor.
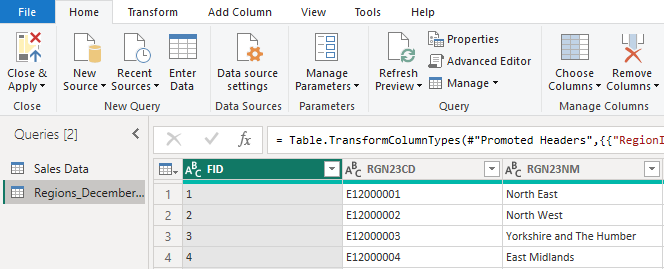
Here we can see the two tables that are part of our data model.

The Sales Data query has been loaded but the regions table is only a preview.
We don’t need the regions table to be loaded into the model.
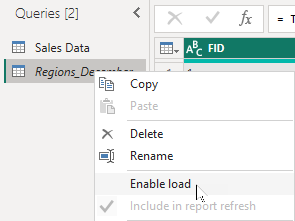
Right-click the regions table and untick Enable load to prevent it from being added.

Unticking this option will stop the table being loaded into the data model.
Instead of loading the entire table, we’ll merge some columns into the Sales Data table.
In the Queries pane on the left, select Sales Data.

The previewed data will change to match the selected table.
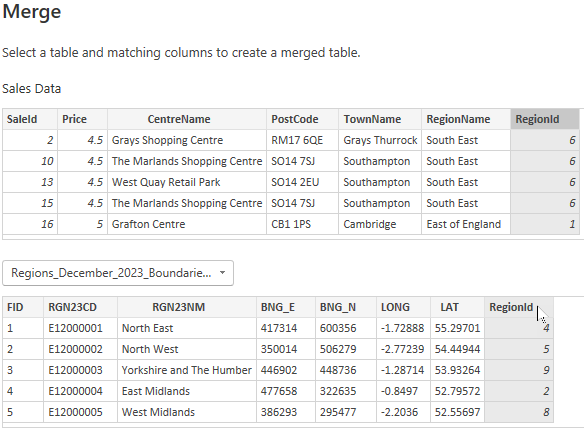
Now we want to pull through the Region Name from the other table using the Merge Queries option.
From the ribbon choose Home | Merge Queries.

Use Append Queries to stack tables and Merge Queries to combine tables.
The preview shows the top rows from each table. Select the overlapping column, RegionId.

Ensure both columns are the same data type.
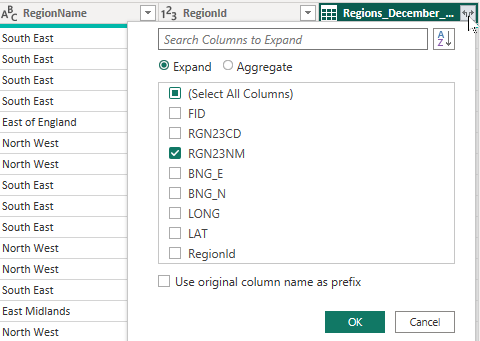
Click the expand arrow above the new column and uncheck everything except RGN23NM (the region name).

This is the only value we need.
This adds the RGN23NM column to the Sales Data table.

This is our link between the sales data and the Shapefile regions.
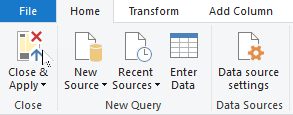
From the ribbon choose Home | Close & Apply to import the modified table into the model.

It is a good idea to save before importing data!
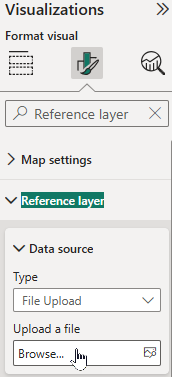
Select the Azure map visual, then go to the Visualizations pane and click the paint brush icon. Under Reference layer | Data source | Upload a file and click the Browse button.

Select the Shapefile zip.
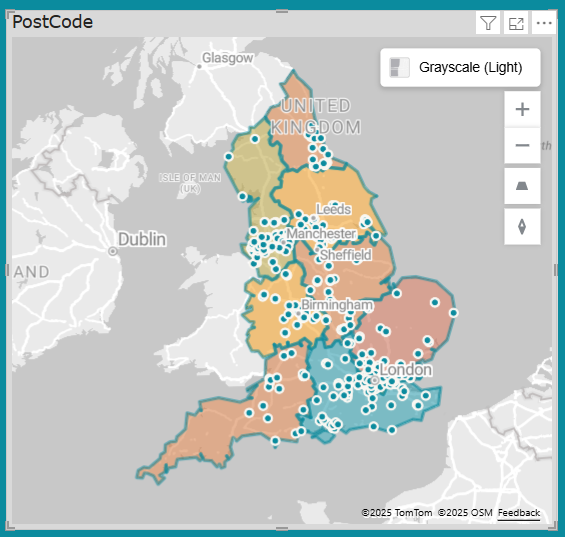
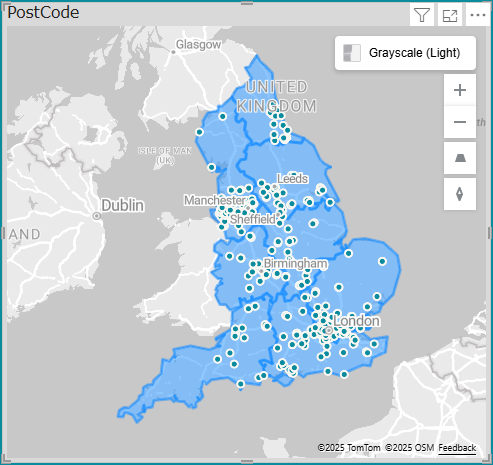
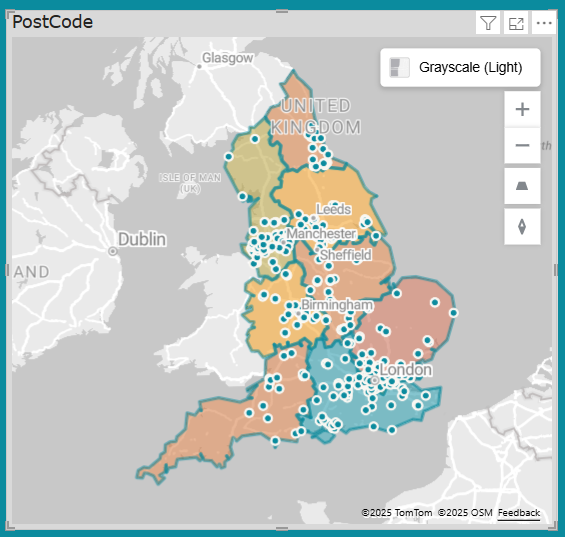
Once imported, your map should look like this

Hopefully these region definitions don't upset anyone!
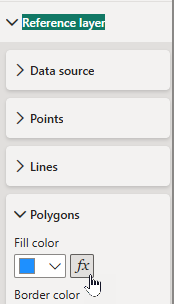
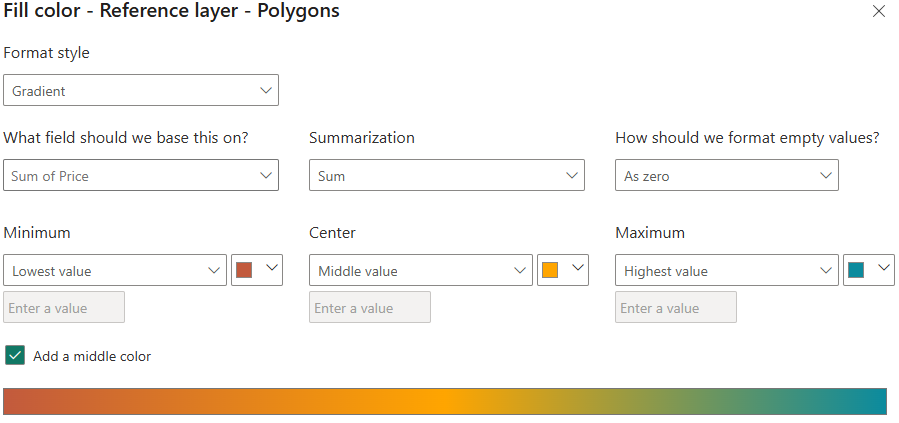
To edit the colours, in the formatting pane go to Polygons and click the fx button next to the Fill color property.

Apply conditional formatting.
For the Format style, select Gradient based on the Sum of Price calculation.

Check with your organisation's style guide to select appropriate colours.
Click Save and enjoy your lovely map.

The options are endless with the reference layer.
Some other pages relevant to the above blog include:
Kingsmoor House
Railway Street
GLOSSOP
SK13 2AA
Landmark Offices
99 Bishopsgate
LONDON
EC2M 3XD
Holiday Inn
25 Aytoun Street
MANCHESTER
M1 3AE
© Wise Owl Business Solutions Ltd 2025. All Rights Reserved.