The Question
I had a delegate reach out to me with a very specific set of criteria.
They wanted to select a department in a slicer that filtered a table showing employees. Selecting an employee from the table would highlight their rows in a list of interests.
We will be using the Create a Creature database rather than real-world data to illustrate the surprisingly complex DAX. Here's how our mock data maps to the real world example:
Original column | Our column | Description |
|---|
Department | FamilyName | This is the main dimension: one Department/Family can have many Employees/Animals. |
Employee | Animal | One Employee/Animal can have multiple Interests/Sales. |
Interest | SaleID | This is the fact column and represents the value we want to highlight. |
You can see what we're trying to achieve in the diagram below: selecting an item in the FamilyName slicer should filter the Animal table; selecting an Animal should highlight the rows in the Sales table.
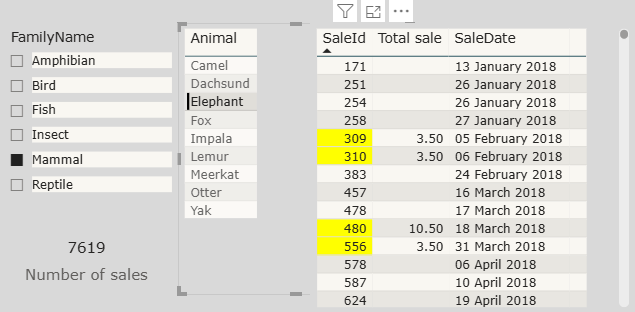
The end goal, select a FamilyName to filter the Animal table, then select an Animal to highlight the matching Sales.
The Problem
When you use a slicer in a Power BI report, it adds a filter to the data in all connected visuals.
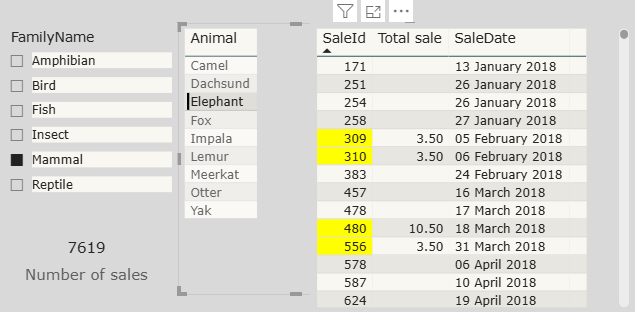
In the diagram below, we can see that choosing Mammal from the FamilyName slicer filters the two table visuals to only show Animals and Sales that belong to that FamilyName.
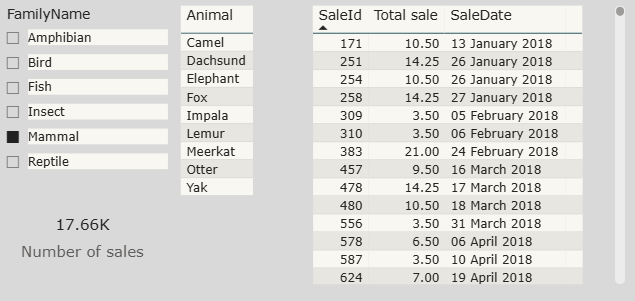
So far so good, the relationships in the model are working.
The Family table and Product tables are joined using the FamilyId column. Product is then joined to Sales using the ProductId column.
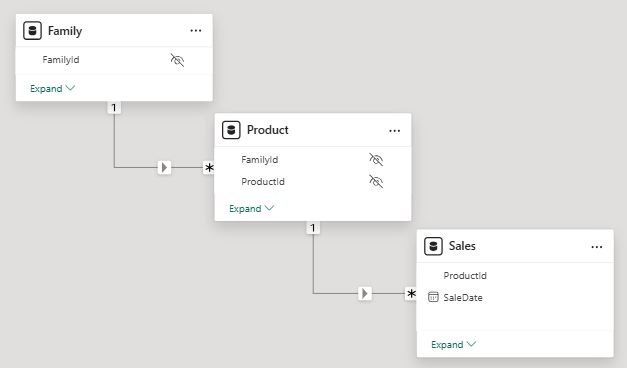
A simple set of 1 to many relationships connecting the tables.
What if you don't want this filter to be applied?
I want to select Elephant in the Animal table but I don't want it to remove the rows belonging to the other Animals from the Sales table.
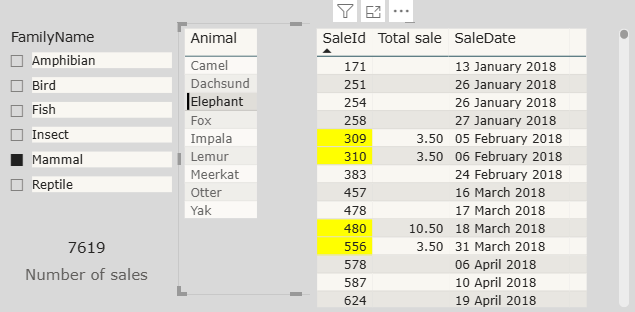
The right hand table shows all the Sales but only highlights those involving Elephant.
"Ahh" I hear you say, just turn off the interaction between the two tables to prevent filtering.
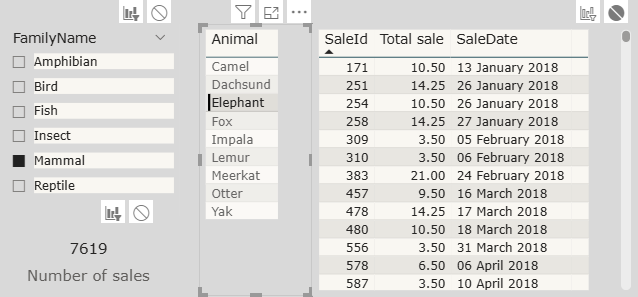
If I do this, all the Sales are now shown but I don't know which ones belong to Elephant.
The answer to this conundrum is not as simple as you may think. Then again, when is DAX ever straightforward?
Forcing every row to appear
When you select Elephant, all non-elephant rows in the Sales table will return BLANK for the Total sale value
We can prove this by going to the Visualisation pane using the dropdown on SaleId and choosing Show items with no data.
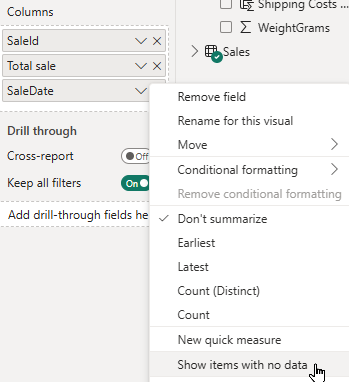
Power BI hides blank rows by default.
This will show all the hidden rows but doesn't help us with the final result.
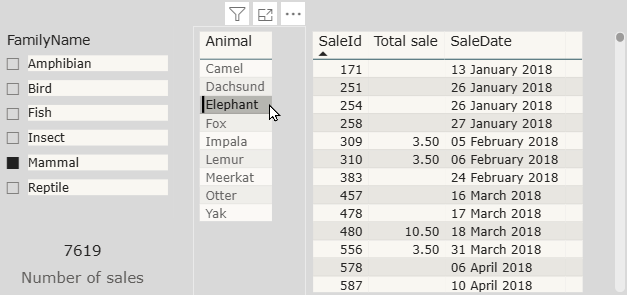
This method is not sustainable, please untick Show items with no data before continuing.
Rather than using the Show items with no data option, we can force these rows to appear by creating a measure which returns a constant value (such as the number 1) for every row in the Sales table.
Right click the Product table in the Data pane and choose New Measure.
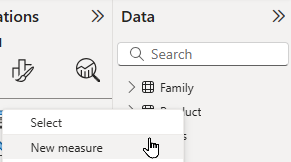
The table you add the measure to does not matter.
At the top of the report in the expression box replace the existing name with something sensible and set it equal to 1.

The name is to the left of the = and the value is on the right.
Adding this measure to the table visual forces every row from the Sales table to appear.
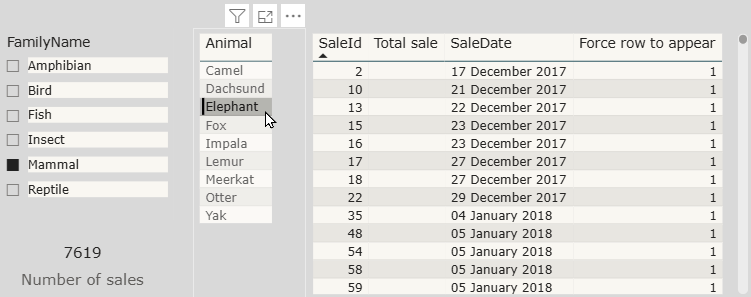
Now the rows have something to show they all reappear.
To show only sales which belong to the selected family we need to compare the FamilyID of the family selected in the slicer with the FamilyID of the product for each sale.
The first step in doing this is to return the FamilyID for the family selected in the slicer. Alter the Force row to appear measure as shown in the diagram below:
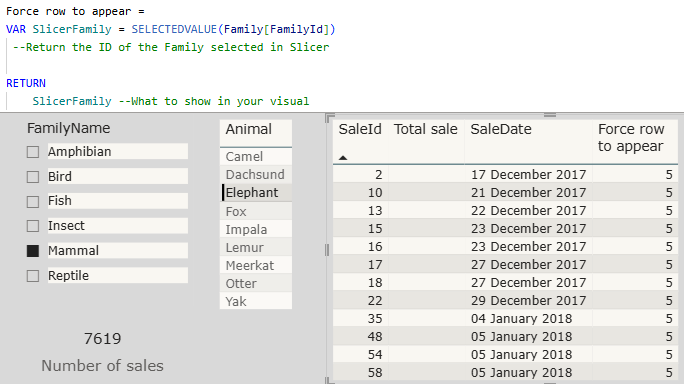
The SELECTEDVALUE function returns the FamilyID for the selected family. For Mammal, this is 5.
At this point, the sales table visual will still show every sale, but the value of the measure will change as you select different families in the slicer.
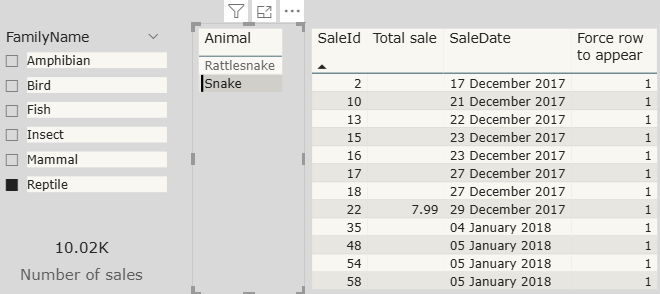
Swapping to Reptile returns a FamilyId of 1 in the last column.
Returning the FamilyID for each sale
Next, we need the measure to retrieve the FamilyId for the product involved in each sale. The first step in doing this is to allow the Sales table to filter the Product table.
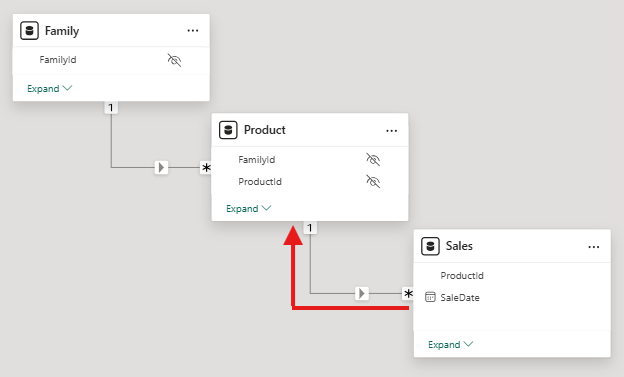
You could do this by changing the filter direction in the Model view but that would affect the entire model; a measure is more precise.
To change the direction of filters in a measure you can use the CROSSFILTER function. Edit the Force row to appear measure as shown in the diagram below:
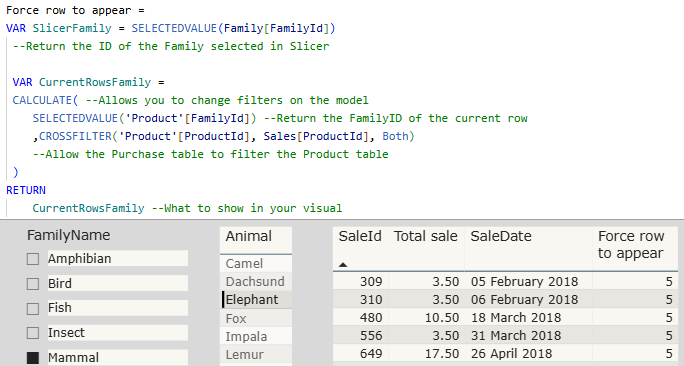
At this point, each sale will still show the FamilyID of the family selected in the slicer.
The reason the measure still returns the FamilyID of the selected family for every sale is that we still have Elephant selected in the table visual.
To fix this, we need to remove the filters on the Product table. You can use the ALL function to remove filters from a column or an entire table. Edit the Force row to appear measure as shown in the diagram below:
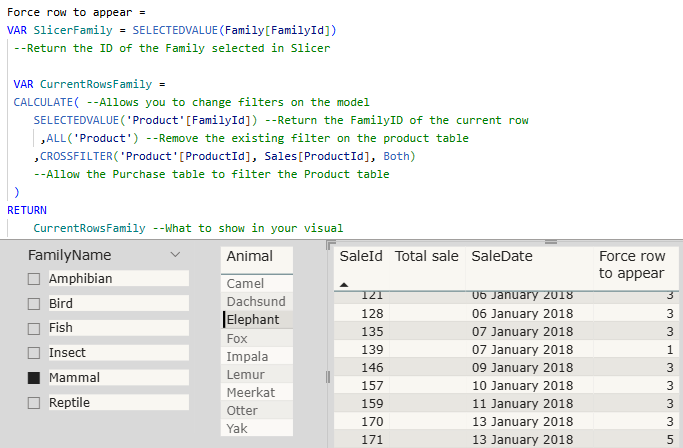
Now we get the correct FamilyID for each sale.
Hiding the non-mammal sales
Now we have the correct FamilyID for each sale, but the table visual is showing every sale even if it wasn't for a Mammal product.
To show only the sales for the selected family, we can check if the current row's FamilyID matches the selected FamilyID we captured earlier. If the values match we can return a constant value to force the row to appear in the table. If the values don't match we can return BLANK to force the row to be hidden in the table visual. Alter the measure as shown in the diagram below:
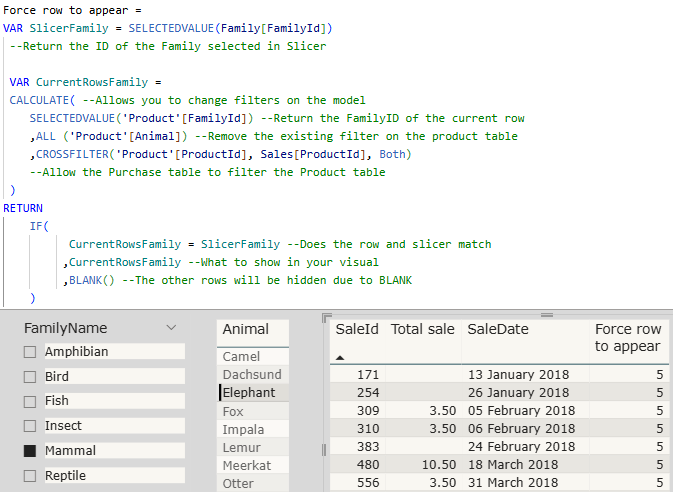
Every row belonging to Mammal is being returned and any others are hidden.
Tidying up the results
Having the FamilyID show up is confusing and unsightly. Alter the measure to return an empty string instead of CurrentRowsFamily as show in the diagram below:
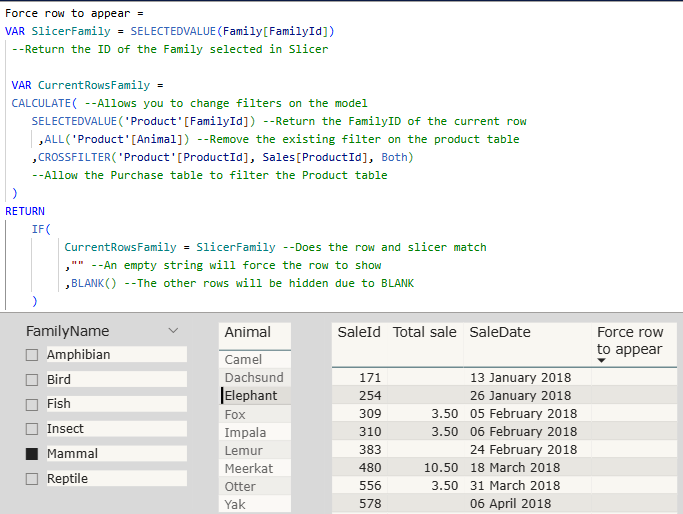
An empty string still counts as a value and won't be hidden like BLANK.
Displaying an apparently empty column in the table looks a little messy. To fix this, right-click on the measure in the field well and choose Rename for this visual.
Change the name to a single space which will almost entirely hide the column in the table.

We need the measure to force the rows to appear but we don't want to see the column.
With that the hardest part is done, now onto highlighting the relevant rows!
Conditional Formatting
To format the sales for the selected animal we need a measure that checks if the row in the Sales table matches the Product selected in the Animal table.
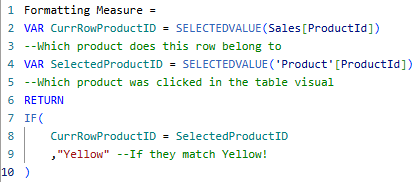
Put in your selected colour and, optionally, your unselected colour.
We can use this measure to apply conditional formatting to the table.
Go to the Visualizations pane and search for Background color then toggle this on.
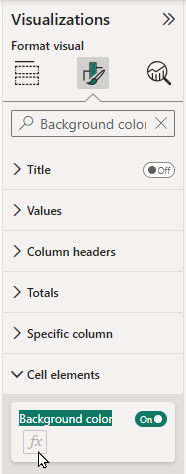
Click the fx button to open the Conditional Formatting dialog box.
To use the measure for formatting we need to swap the Format style to Field value.
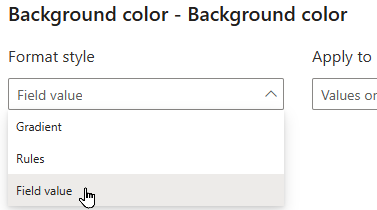
This uses the contents of a column or measure for formatting.
Under What field should we base this on? find and select your Formatting Measure.
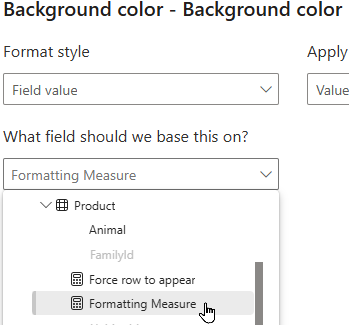
The measure must return text to be selectable.
Now, when you select an Animal from the table, all the relevant rows will be highlighted in the Sales table.
Now go forth and amaze your colleagues.


