Read our blogs, tips and tutorials
Try our exercises or test your skills
Watch our tutorial videos or shorts
Take a self-paced course
Read our recent newsletters
License our courseware
Book expert consultancy
Buy our publications
Get help in using our site
468 attributed reviews in the last 3 years
Refreshingly small course sizes
Outstandingly good courseware
Whizzy online classrooms
Wise Owl trainers only (no freelancers)
Almost no cancellations
We have genuine integrity
We invoice after training
Review 30+ years of Wise Owl
View our top 100 clients
Search our website
We also send out useful tips in a monthly email newsletter ...
Connecting to an API in Power BI |
---|
API (Application Programming Interface) allow you to connect to the data on a webpage without all the faff of the front end. |
Pulling data from websites into Power BI reports can be a frustrating process due to all the parts aimed at humans.
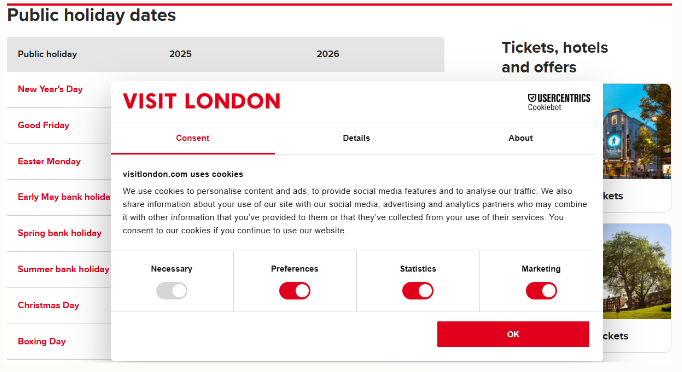
Take this website listing out the Bank Holidays in the UK which is a little cluttered.
Pop ups, adverts, and check boxes all stopping me from getting the data!
Some companies will provide an easier way of pulling data from their websites in the form of an Application Programming Interface (or API to its friends).
An API creates a tunnel between your computer and the website's data source.
The API cuts out the website and connects you directly to the data.
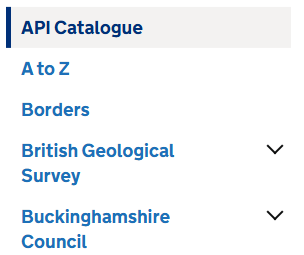
Not every organisation will have an API and, even if it does, it may charge you to use it. A great resource to try different kinds of APIs for free is the UK public sector APIs site which has a huge variety of styles and subjects.
A few of the APIs available.
Let's have a look at a specific API to get an idea of how they work.
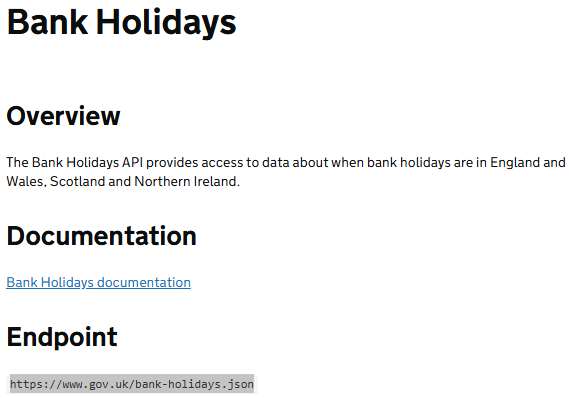
Of all the APIs on the above website, the one I use most is the Bank Holiday API.
Calculating when Bank Holidays are in the UK is, to put it mildly, a pain. This API returns for each country in the UK the bank holiday names, descriptions, dates and need for bunting.
This site provides the API endpoint, a brief description and a link to further information.
The endpoint of an API is a URL that normally returns data in the form of JSON.
JSON (JavaScript Object Notation) is a way of passing data that is legible to humans but still efficient for computers.
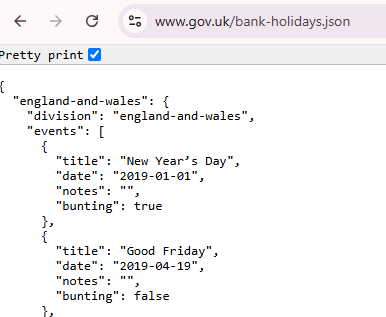
Putting this endpoint into a browser will return a set of JSON.
JSON is made up of several different things including arrays, objects and named pairs.
Name | What it looks like | Example |
---|---|---|
Named Pair | A field name in quotation marks, then a colon and finally the field value. | "title": "Good Friday" |
Object | Multiple named pairs separated by commas in a set of braces. | {"title": "Good Friday", "date": "2019-04-19"} |
Array | A name in a set of quotations, a colon, then a series of objects in a set of square brackets. | "events": [ {"title": "Good Friday", "date": "2019-04-19"},{"title": "New Year's Day", "date": "2019-01-01"} ] |
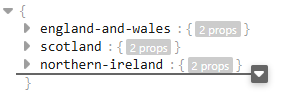
The Bank Holiday JSON returns an object containing a comma separated list of country objects.
Each country is a separate object.
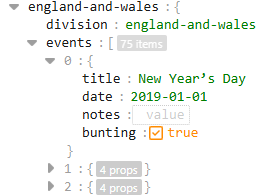
Each of the country objects contains a named pair and an array of all the events.
England and Wales have 75 bank holidays in its array.
The array is made up of an object for each bank holiday containing four named pairs: title, date, notes and bunting.
Three text values and one Boolean (true or false).
Don't worry too much about this as thankfully Power BI can read JSON files for you.
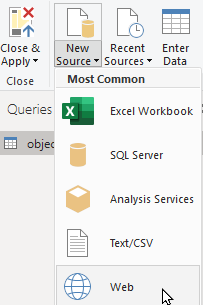
The Web connector can pull data from websites, SharePoint documents, OneDrive files and APIs.
This is a versatile data source.
Copy and paste in the endpoint URL from the previous section.
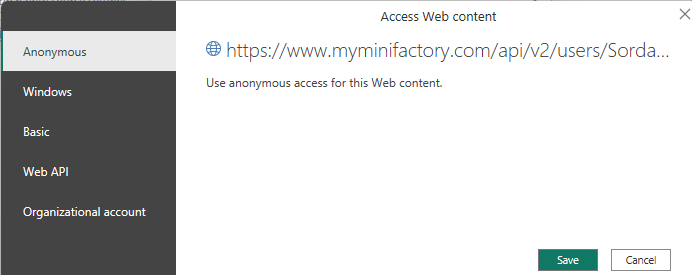
The Basic option works with simple APIs like this.
The Access Web content page lets you choose how you want to pass any credentials to the target website.
For public APIs like this we can use the Anonymous option.
Power BI will return the highest level by default which was the three country objects.
The three objects contained a named pair and an array which Power BI reads as a List.
On the events column header, click the arrow icon and then Expand to New Rows from the drop down.
We need to expand the List into separate rows.
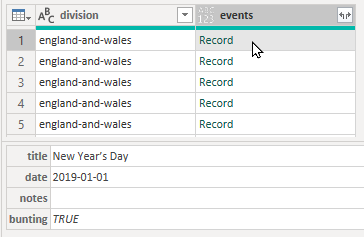
Each row is made up of multiple columns which Power BI displays as a Record.
Clicking on the cell next to the word Record will give a preview of all the columns and their values.
In Scotland the 2nd of January is also a holiday!
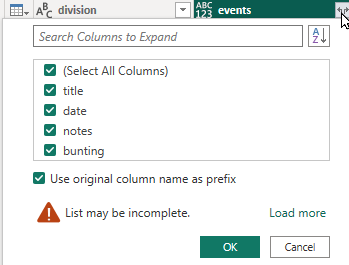
In the events column header, click the arrow icon again and tick all the columns you want to return.
By default all the column names will be prefaced with the list name - events.
This will expand the Record giving you one column for each item you ticked.
Finally a useable table of data!
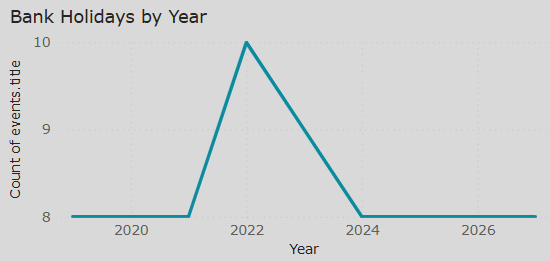
Use this new table to classify dates in your calendar table or check how many bank holidays you get per year.
2022 featured additional bank holidays for Queen Elizabeth's Platinum Jubilee and later State funeral.
Some other pages relevant to the above blog include:
Kingsmoor House
Railway Street
GLOSSOP
SK13 2AA
Landmark Offices
99 Bishopsgate
LONDON
EC2M 3XD
Holiday Inn
25 Aytoun Street
MANCHESTER
M1 3AE
© Wise Owl Business Solutions Ltd 2025. All Rights Reserved.