Read our blogs, tips and tutorials
Try our exercises or test your skills
Watch our tutorial videos or shorts
Take a self-paced course
Read our recent newsletters
License our courseware
Book expert consultancy
Buy our publications
Get help in using our site
493 attributed reviews in the last 3 years
Refreshingly small course sizes
Outstandingly good courseware
Whizzy online classrooms
Wise Owl trainers only (no freelancers)
Almost no cancellations
We have genuine integrity
We invoice after training
Review 30+ years of Wise Owl
View our top 100 clients
Search our website
We also send out useful tips in a monthly email newsletter ...
Using Excel Checkboxes |
---|
Various ways to use Excel Checkboxes |
In this blog
Until the summer of 2024, adding checkboxes to Excel was only possible through VBA and Forms. Checkboxes are available to non-VBA users now and below is just one example of how you could use them.
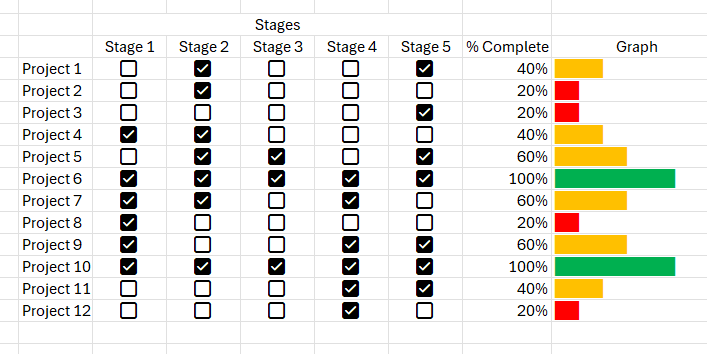
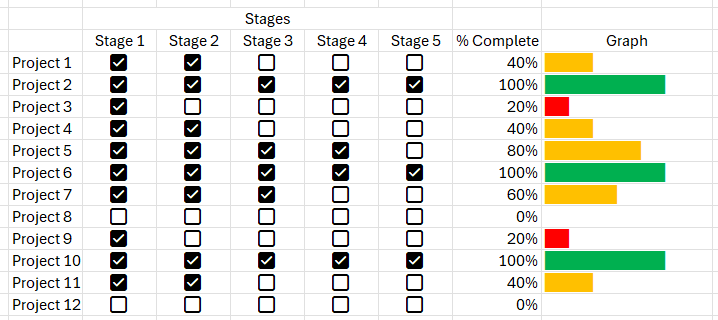
You have a variety of projects, all with 5 stages that you want to monitor from beginning to completion.
The above table is easy to use and effectively shows the progress of the projects.
This blog will go explain how to insert checkboxes, determine if they've been ticked and use that outcome to report the progress.
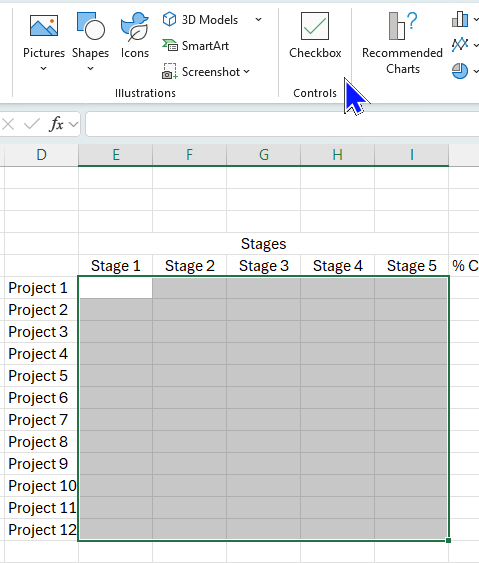
Select the cells you want to insert checkboxes into and from the ribbon choose Insert | Checkbox.
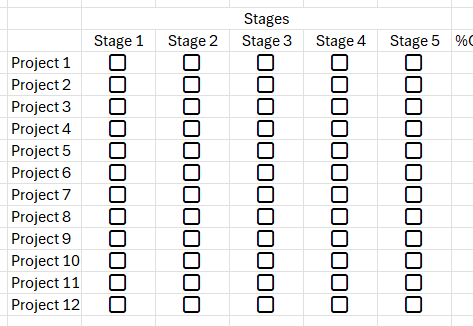
A single checkbox will be inserted into each cell.
When you insert checkboxes they are all unchecked by default.
Once the checkboxes have been inserted you can set up how to test them for checked/unchecked.
The value of a checkbox is set as True when checked and False when unchecked. This means we can use various Excel Logical functions such as IF(), SUMIF() and COUNTIF().
To show the % complete for each project I will need to count how many checkboxes are ticked and divide by the total number of checkboxes.
We can use the COUNTIF function to count the number of checked checkboxes. Here's the syntax of the function:
=COUNTIF(range, criteria)
In our example, the range will be the cells with checkboxes in and the criteria will be True.
We can use the COUNTA function to count the total number of cells containing checkboxes. Here's the syntax of the function:
=COUNTA(value1,[value2]..)
We only need a single value, the range of cells with checkboxes in.
Here's the formula we can use for the first row in our example:
The formula entered against the first project, our checkbox cells are E6 to I6.
Format the cell as a percentage and copy the formula to the other projects.
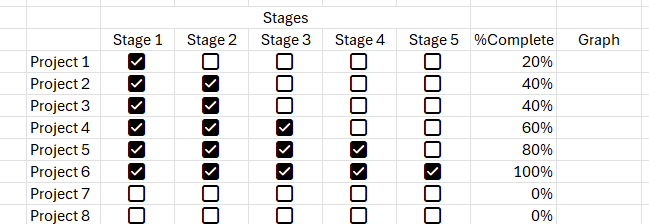
Try selecting various checkboxes to see the result.
For some users it would be enough to show just percentage complete value, but I think that adding a data bar type visual with red, amber and green status really improves the project completion status.
To create a data bar visual we can use the UNICHAR function. This function will return the Unicode character referenced by the given numeric value. Here's the syntax of the function:
=UNICHAR(number)
To find the correct number to use, you can perform a web search for UNICHAR codes.
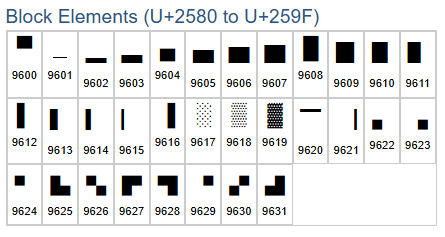
This table shows block type elements and their corresponding codes.
For our example we will be using code 9608, which is a full block. To achieve the desired effect we need to repeat this character a certain number of times to represent the percentage complete figure.
The REPT function allows you to repeat text a stated number of times. Here's the syntax of the function:
=REPT(text, number of times)
Using both the REPT and UNICHAR functions together will give the desired result.
The formula entered against the first project, with cell J6 being the % complete.
Copy the formula down to the other projects and select a variety of the checkboxes to ensure its working.
You can clearly see the differing lengths of the data bars for each project.
Our data bars use the standard font colour of the cell, so the last thing to do is add conditional formatting to give the red, amber and green colours.
We are going to use red for less than or equal to 20%, amber for greater than 20% but less than 100% and green for 100%.
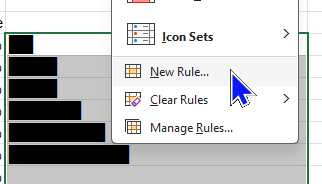
Select all the cells containing data bars and from the ribbon choose Home | Conditional Formatting | New Rule...
Choose this option to start configuring conditional formatting.
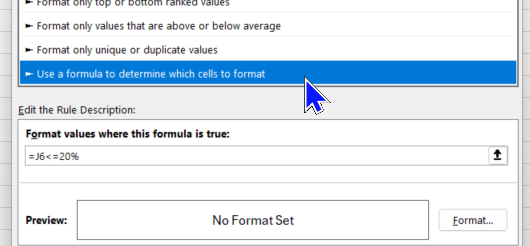
On the dialog box which appears, choose Use a formula to determine which cells to format and then enter a formula as shown below:
Enter =J6<=20% in the Format values where this formula is true box.
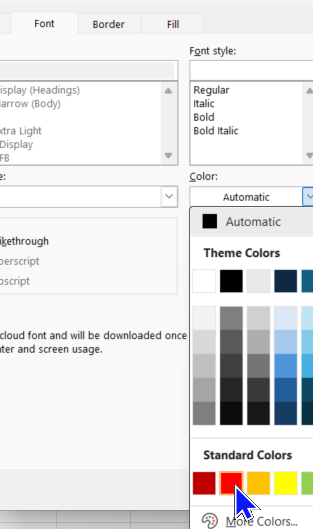
Click the Format... button and choose a font colour as shown below:
On the Font tab, set the Color to red.
Now we can follow the same process to add the other two rules for amber and green.
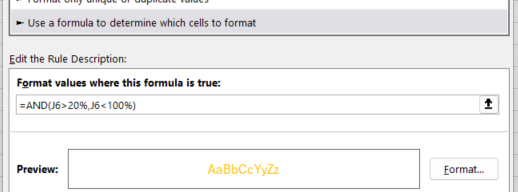
We can use the AND function for the amber rule to test that the value is both greater than 20% and less than 100%. Here's the syntax of the function:
=AND(logical1,[logical2],....)
Use the AND function in the rule as shown below:
Enter =AND(J6>20%,J6<100%) for the rule, then set the font colour.
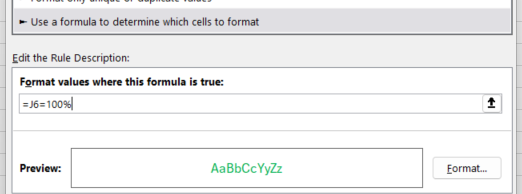
The final rule will be for when the project is complete. Set up a new conditional format as shown below:
Set the rule to =J6=100%, setting the font colour to green
If you need to edit any rules, you can choose Home | Conditional Formatting | Manage Rules... from the ribbon.
You can clearly see each rule with the corresponding format and cells the rule is applied to
Try selecting various checkboxes to see if the desired result has been attained.
The data bars are working fine. Note the lack of data bars for projects not yet started.
Now you can impress your colleagues with some new Excel skills!
Some other pages relevant to the above blog include:
Kingsmoor House
Railway Street
GLOSSOP
SK13 2AA
Landmark Offices
99 Bishopsgate
LONDON
EC2M 3XD
Holiday Inn
25 Aytoun Street
MANCHESTER
M1 3AE
© Wise Owl Business Solutions Ltd 2025. All Rights Reserved.