Read our blogs, tips and tutorials
Try our exercises or test your skills
Watch our tutorial videos or shorts
Take a self-paced course
Read our recent newsletters
License our courseware
Book expert consultancy
Buy our publications
Get help in using our site
547 attributed reviews in the last 3 years
Refreshingly small course sizes
Outstandingly good courseware
Whizzy online classrooms
Wise Owl trainers only (no freelancers)
Almost no cancellations
We have genuine integrity
We invoice after training
Review 30+ years of Wise Owl
View our top 100 clients
Search our website
We also send out useful tips in a monthly email newsletter ...
A new model explorer, with the ability to create calculation groups Part three of a three-part series of blogs |
---|
It's in preview at the moment, but it's worth knowing that a new model explorer is coming to Power BI proper soon. This is a good thing, but the calculation groups which will also now be available are not for the faint-hearted!
|
Calculation groups are not for the faint-hearted! If you're only just getting to grips with measures and DAX, I'd come back to this blog in a year or two's time. But if you're the sort of person who gets frustrated by having to type similar measures in over and over again, calculation groups could be for you!
A warning which I will repeat below: you pay a price for using calculation groups, which is that you can no longer just drag numerical fields onto your visuals. Instead you will have to create an explicit measure for every aggregation that you want to perform.
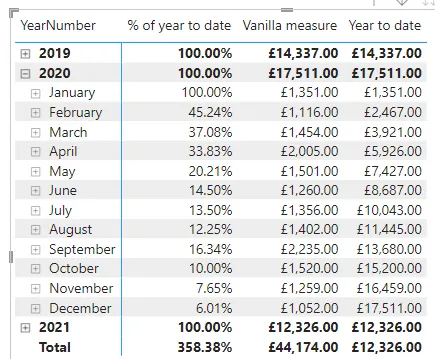
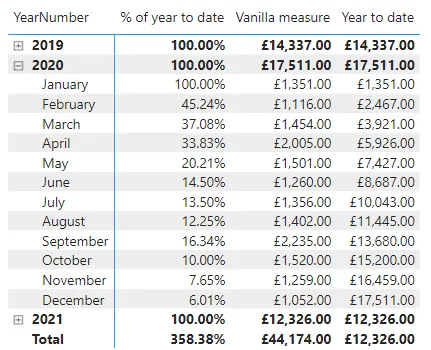
Suppose that you want to create the following matrix:
The matrix is showing total quantity, year to date and (at the start) the first figure divided by the second. So in February 2020 sales of £1,116.00 are 45.24% of £2,467.00, the cumulative sales for 2020 to date.
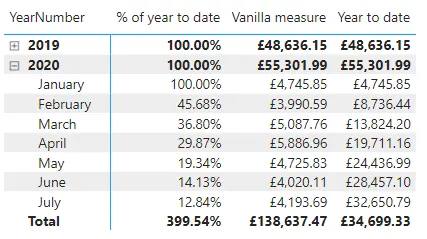
But (and it's a big but) suppose that you frequently want to calculate the same 3 values for other figures:
Here we're calculating the same figures, but for the prices not the quantities sold.
To avoid having to duplicate measures you could create a calculation group called YTD figures, containing the 3 calculated columns given:
Although 3 columns will appear, just one calculation group does.
Here's how to do this in Power BI, using the new calculation groups.
Note that you've been able to do this in Power BI for some time using the Tabular Editor external tool, but with the new semantic model editor you can create calculation groups within Power BI itself for the first time.
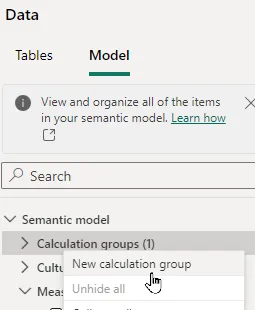
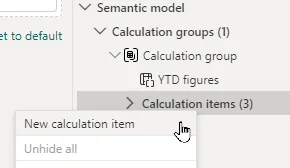
Start by adding a calculation group to your model:
Here I'm adding a new calculation group to my model.
You can now rename this, then add 3 calculation items to your calculation group (one for each of the columns you want to display in your visual):
Adding a calculation item.
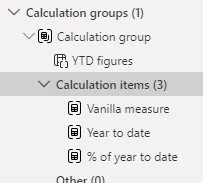
Here's what I called my calculation items:
I've renamed each of my new calculation items.
And here's the formula that each calculation item contains:
Calculation item | DAX formula |
---|---|
Vanilla measure | Vanilla measure = SELECTEDMEASURE() |
Year to date | Year to date = CALCULATE( SELECTEDMEASURE(), DATESYTD('Calendar'[DateKey]) ) |
% of year to date | % of year to date = var CurrentValue = SELECTEDMEASURE() var YearToDate = CALCULATE( SELECTEDMEASURE(), DATESYTD('Calendar'[DateKey]) ) // value for this period divided by year to date RETURN DIVIDE(CurrentValue,YearToDate) |
In this context SELECTEDMEASURE() will refer to whatever measure I want to use as the base for my formula.
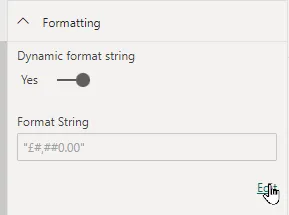
I've also set a dynamic formatting string for each of these 3 calculation items - here's an example:
You can click on the Edit button then type in the formatting string that you want to use in the formula bar.
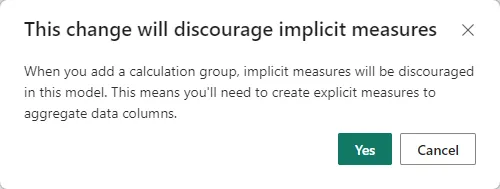
When you add your first calculation group, you will be asked to confirm that you want to discourage the use of implicit measures:
The wording is very strange: as far as I can see you just can't use implicit measures any more.
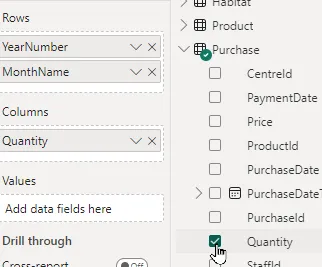
What this means is that when you click on any field in a table, Power BI will automatically assume that you want to use it as a categorisation value, rather than something to be aggregated:
Previously Power BI would have let you add an implicit measure summing the quantity - but not any longer, now you've chosen to use calculation groups!
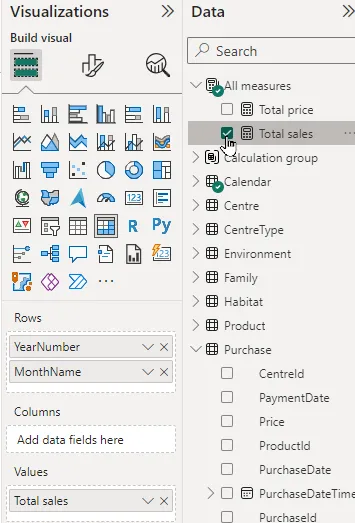
To use your group, you must first create an explicit measure for the base measure that you want to reference:
My formula for my Total sales measure is Total sales = SUM(Purchase[Quantity]).
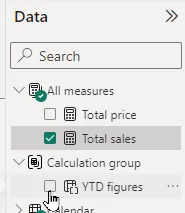
You can now tick your calculation group:
Tick a calculation to add its calculation items to your visual.
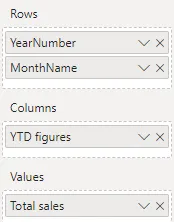
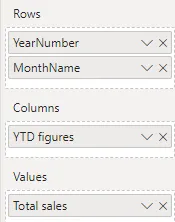
Your visual (here a matrix) shows that you are calculating your calculation group for the total sales measure:
The final fields in the matrix.
Giving the 3 columns we wanted in the matrix:
The final matrix.
Was it worth it? If you're building a model in SSAS Tabular Services for other people to use, perhaps yes, but was it really worth porting this techie feature into Power BI Desktop, where it will surely confuse most users?
Parts of this blog |
---|
|
Some other pages relevant to the above blogs include:
Kingsmoor House
Railway Street
GLOSSOP
SK13 2AA
Landmark Offices
99 Bishopsgate
LONDON
EC2M 3XD
Holiday Inn
25 Aytoun Street
MANCHESTER
M1 3AE
© Wise Owl Business Solutions Ltd 2024. All Rights Reserved.