-
Our training courses
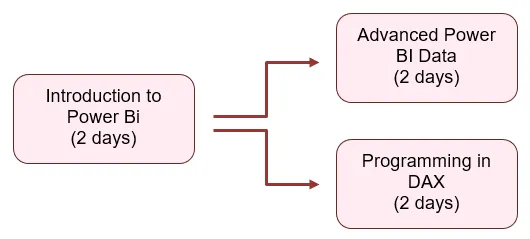
Excel (and 365) Training Basic Excel Advanced Excel VBA Macros Microsoft 365 Excel Introduction Excel Intermediate Excel Advanced Excel Business Modelling Power Pivot for Excel Excel VBA macros Advanced VBA Fast track Excel VBA Using Microsoft 365 Office scripts Power Platform Training Pure Power BI DAX and fast-track Power Automate Power Apps Introduction to Power BI Adv. Power BI Reports Adv. Power BI Data Writing M for Power Query DAX for Power BI Fast track Power BI Fast track Power BI/DAX Power Automate Desktop Basic Power Automate Advanced Power Automate Fast track Power Automate Power Apps Programming and AI SQL training Visual C# training Python training AI training Introduction to SQL Advanced SQL Fast track SQL Introduction to MySQL Introduction to Visual C# Intermediate C# Fast track C# Introduction to Python Advanced Python Fast track Python Prompt engineering Using AI tools Using the OpenAI API Copilot Studio agents SQL Server training Reporting Services Report Builder Integration Services SSAS Reporting Services Advanced SSRS Fast track SSRS Report Builder Introduction to SSIS Advanced SSIS Fast track SSIS SSAS - Tabular Model You can see a calendar showing our current course schedule here. -
Other training resources
Free resources
Read our blogs, tips and tutorials
Try our exercises or test your skills
Watch our tutorial videos or shorts
Take a self-paced course
Read our recent newsletters
Paid servicesLicense our courseware
Book expert consultancy
Buy our publications
Getting helpGet help in using our site
- Our training venues
-
Why we are different
Transparent reviews
440 attributed reviews in the last 3 years
Delivery of coursesRefreshingly small course sizes
Outstandingly good courseware
Whizzy online classrooms
Wise Owl trainers only (no freelancers)
Nicer to work withAlmost no cancellations
We have genuine integrity
We invoice after training
Reliable and establishedReview 30+ years of Wise Owl
View our top 100 clients
-
Search our website
GO -
+44 (161) 883 3606 sales@wiseowl.co.uk Web enquiry form We also send out useful tips in a monthly email newsletter ...


