Read our blogs, tips and tutorials
Try our exercises or test your skills
Watch our tutorial videos or shorts
Take a self-paced course
Read our recent newsletters
License our courseware
Book expert consultancy
Buy our publications
Get help in using our site
562 attributed reviews in the last 3 years
Refreshingly small course sizes
Outstandingly good courseware
Whizzy online classrooms
Wise Owl trainers only (no freelancers)
Almost no cancellations
We have genuine integrity
We invoice after training
Review 30+ years of Wise Owl
View our top 100 clients
Search our website
We also send out useful tips in a monthly email newsletter ...
Make an SSRS matrix dynamic, like a pivot table Part two of a two-part series of blogs |
---|
Create a matrix whose row, column and data fields are all selectable from dropdown lists.
|
The steps to follow to create our matrix are:
Here's the sort of effect we're trying to achieve:
The user can choose the row, column and data fields from dropdowns.
For each of these 3 parameters you should follow more or less the same steps. I'll show how to create the column field dropdown (the other two will be created in the same way). First create a parameter:
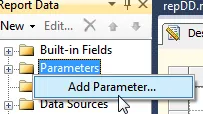
Right-click on Parameters and choose to add a new one.
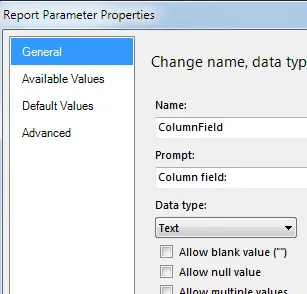
Give your new parameter a sensible name and prompt:
We'll call this parameter ColumnField, and specify that it's of type Text.
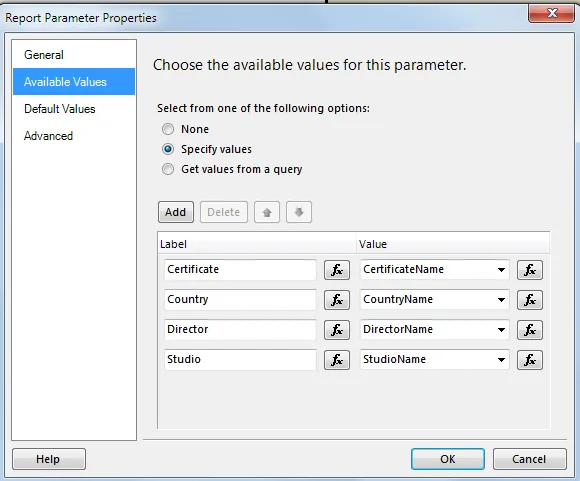
Now make this into a dropdown parameter by adding available values (one for each possible field value that a user can choose):
Here the columns can be certificates, countries, directors or studios.
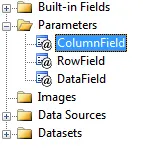
When you've done this for all 3 parameters, you should have something like this:
The 3 parameters which will be chosen at the top of your report.
You should also set default values for all 3 parameters, so that a sensible matrix appears when you first run the report.
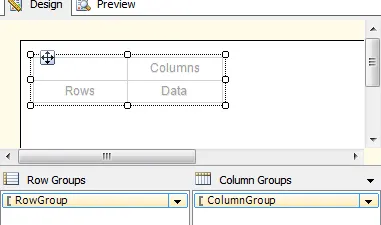
Now that you have your 3 dropdown parameters, it's time to create the matrix. To do this, add a basic matrix:
Create a basic matrix - we'll add the row and column groupings in a second.
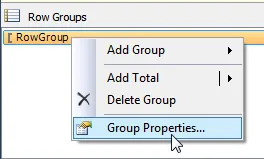
What you now have to do is to specify the row and column groups, and the data field. To do the row group, for example, first change the group's properties:
Right-click on the RowGroup and change its properties.
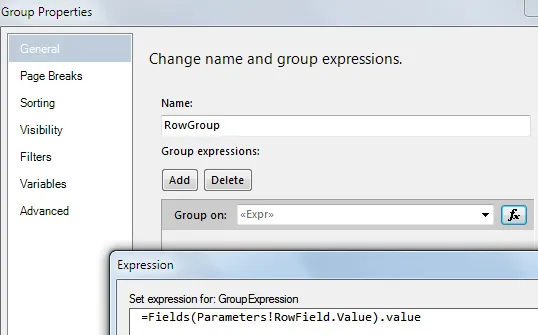
Set the grouping field to be an expression:
Add a group expression, and set this to be the field chosen by the user in the drop list.
You can set the colum grouping expression to be something similar:
The column grouping expression uses the same concept.
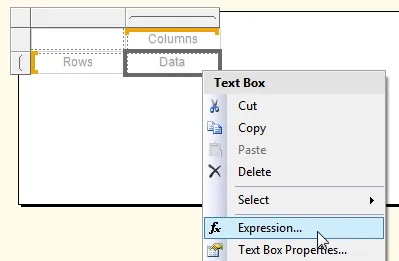
For the data expression, right-click on the data text box and choose to set an expression for it:
Right-click on the Data textbox and set its expression.
We'll show the average of the data field chosen in the parameter drop list:
Show the average of a field whose name is chosen by the user at run-time.
You now need to add labels and a title for your report:
As it is now | The final report |
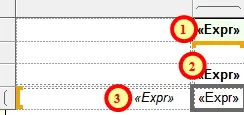
For box number 1 (the matrix title), you want it do display something like:
The title will refer to the parameter choices made by the user.
A typical title will thus look something like this:
The title if you show average budget by certificate and director.
For box numbers 2 and 3, you could use expressions like this:
Box number | Expression |
---|---|
2 | =Fields(Parameters!ColumnField.Value).value |
3 | =Fields(Parameters!RowField.Value).value |
Notice that we keep repeating the same trick - using the Fields collection to refer to a field whose name is equal to the value of the relevant dropdown parameter.
If you're fired up after reading this article, you could try creating a report with dynamic grouping (ie the user chooses which field they want to group by).
Parts of this blog |
---|
|
Some other pages relevant to the above blogs include:
From: | abhinav24 |
When: | 24 Oct 17 at 14:22 |
What if I want to have multi select parameters to do this. Do you have an example to set the expression for row or column groups for multi select parameters. This would effectively be like grouping with AND condition on multiple fields.
From: | Andy B |
When: | 24 Oct 17 at 17:15 |
An interesting question! The problem is that as far as I know you can't group by than one field at once. I think it would be very complicated. You'd have to somehow include more than one grouping level, then hide the grouping levels you didn't need if you only chose one value in the multivalue parameter.
The only other possibility that I can see is to create some composite field containing all of the things you might want to group by (so if you can choose to group by one or more of Director, Studio and Certificate, create every possible combination of these fields as separate composite keys). Not only would this be ridiculously complicated, but I don't think it would give the right results.
Any ideas, anyone?
From: | Anders |
When: | 03 Jul 21 at 16:58 |
hello,
I struggle with the same requirements now, I need to give user possibility to choose which attributes will dynamically find in the row group.. is there any solution for that?
Regards!!
From: | Andrew G |
When: | 06 Jul 21 at 08:58 |
Hi Anders,
There's no simple solution as far as I know. You'll have to choose the least worst option from:
Writing a long IIf or Switch function to work out which fields to group on;
Creating multiple hidden tables and showing one of them depending on the user's choice;
Creating a separate page for each combination of groups and using navigation tools to allow the user to reach each page.
Kingsmoor House
Railway Street
GLOSSOP
SK13 2AA
Landmark Offices
99 Bishopsgate
LONDON
EC2M 3XD
Holiday Inn
25 Aytoun Street
MANCHESTER
M1 3AE
© Wise Owl Business Solutions Ltd 2024. All Rights Reserved.