Read our blogs, tips and tutorials
Try our exercises or test your skills
Watch our tutorial videos or shorts
Take a self-paced course
Read our recent newsletters
License our courseware
Book expert consultancy
Buy our publications
Get help in using our site
551 attributed reviews in the last 3 years
Refreshingly small course sizes
Outstandingly good courseware
Whizzy online classrooms
Wise Owl trainers only (no freelancers)
Almost no cancellations
We have genuine integrity
We invoice after training
Review 30+ years of Wise Owl
View our top 100 clients
Search our website
We also send out useful tips in a monthly email newsletter ...
Colouring the table row for a selected item in Power BI |
---|
How can you highlight the row in a table corresponding to the slicer value you've chosen? With a disconnected slicer and a clever measure! |
In this blog
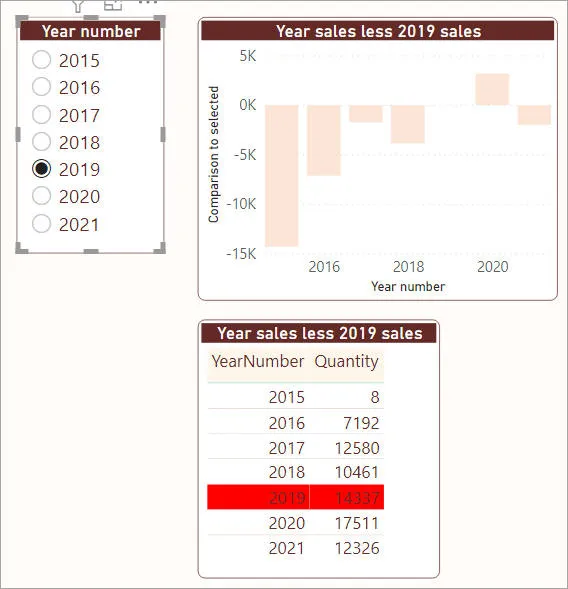
There's a bit more to this blog than the title suggests, but the main point is: how can you get this to work?
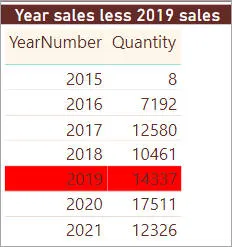
When you click on (for example) 2019, the chart at the top should change to show sales relative to this year and the relevant year number should be highlighted in the table at the bottom.
If you want to see the solution yourself (or follow along) you can download the files you'll need here.
This seems at first glance straightforward, until you realise that this isn't a visual interaction:
Power BI isn't filtering the table to show the year selected in the slicer, it's just highlighting it.
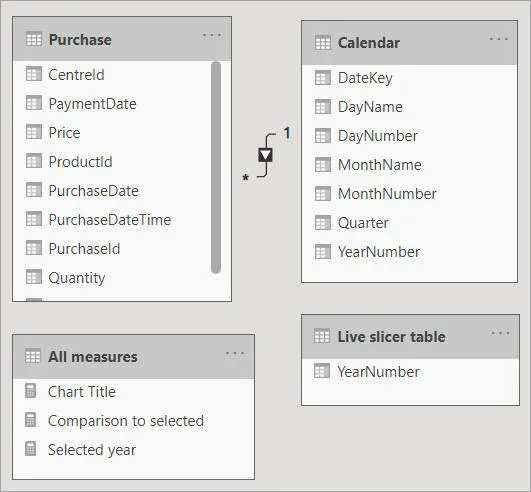
The solution is to have two copies of the calendar table:
The calendar table has been loaded twice. One of the versions has been linked to the table of purchases in the usual way, but the other one (Live slicer table) is disconnected from any other table.
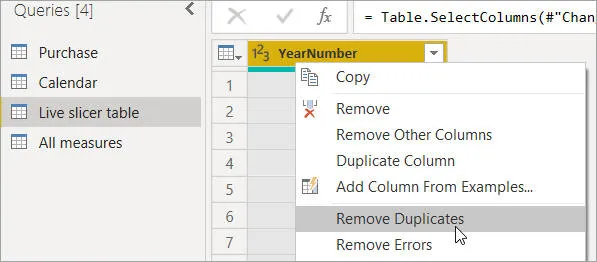
You can easily achieve this effect by removing all other columns apart from the year number from the second instance of the Calendar table in Query Editor, then removing duplicates from the remaining column:
Removing duplicates from the remaining YearNumber column will give a list of the years in our model (this will be the basis for the slicer).
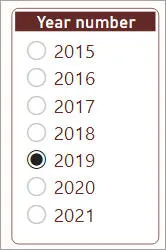
You can now create a slicer based on the YearNumber column in the Live slicer table:
The only problem now is that when you select a year number in the slicer, nothing updates!
Create this measure (if you're not sure what a measure is, consider booking onto our two-day DAX course instead!):
Selected year = IF(
// test if the year number shown in the calendar is the
// same as the one selected in the slicer
SELECTEDVALUE('Calendar'[YearNumber]) =
SELECTEDVALUE('Live slicer table'[YearNumber]),
// if it is, colour the row red; otherwise, white
"Red",
"White"
)
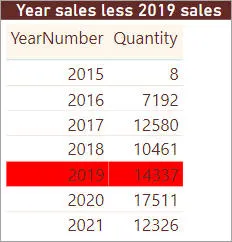
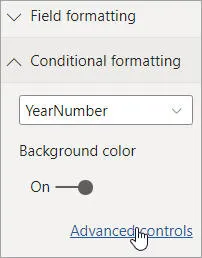
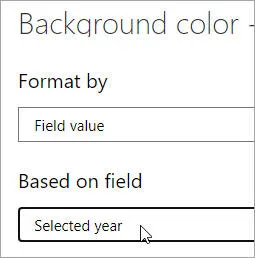
Now set the background colour of each of the columns of your table to be this measure:
Set the back colour ... | ... to be your measure. |
There are a couple of other measures used in this report. The table's title has been set to the value of this measure:
Chart Title =
-- show the selected year within the title
"Year sales less " &
VALUES('Live slicer table'[YearNumber]) &
" sales"
You can then get it this measure to be the source of your table's title:
Set the Title property of the table to this Chart Title measure.
Finally, the chart is showing this measure:
Comparison to selected =
VAR SelectedValue =
-- get the currently selected slicer year
VALUES('Live slicer table'[YearNumber])
VAR OriginalColumnValue =
-- get total sales for the current filter context
-- (ie for each year shown in chart)
Sum(Purchase[Quantity])
VAR TheSlicerCalculation =
-- replace the row/column filter with the year chosen by the user
CALCULATE(
SUM(Purchase[Quantity]),
'Calendar'[YearNumber] = SelectedValue
)
-- subtract the sales for the year chosen by the user away
-- from the current column/row sales
Return OriginalColumnValue - TheSlicerCalculation
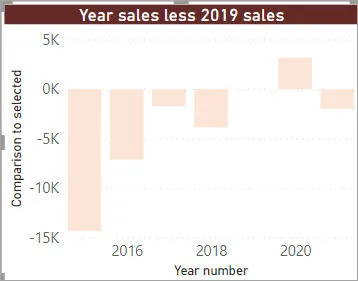
Setting this to be the value showin in your column chart should give this (again assuming you've selected 2019 as your slicer year):
Obviously the figure for the chosen slicer year - in this case 2019 - will always be 0.
All clever stuff!
Some other pages relevant to the above blog include:
Kingsmoor House
Railway Street
GLOSSOP
SK13 2AA
Landmark Offices
99 Bishopsgate
LONDON
EC2M 3XD
Holiday Inn
25 Aytoun Street
MANCHESTER
M1 3AE
© Wise Owl Business Solutions Ltd 2024. All Rights Reserved.