Read our blogs, tips and tutorials
Try our exercises or test your skills
Watch our tutorial videos or shorts
Take a self-paced course
Read our recent newsletters
License our courseware
Book expert consultancy
Buy our publications
Get help in using our site
559 attributed reviews in the last 3 years
Refreshingly small course sizes
Outstandingly good courseware
Whizzy online classrooms
Wise Owl trainers only (no freelancers)
Almost no cancellations
We have genuine integrity
We invoice after training
Review 30+ years of Wise Owl
View our top 100 clients
Search our website
We also send out useful tips in a monthly email newsletter ...
Understanding filter context in DAX |
---|
Understanding filter context is the key to understanding how to create measures in DAX. This blog aims to explain this vital subject as succinctly as possible! |
One of the most frustrating terms this owl heard when starting to use DAX was filter context. This blog aims to explain what filter context means in simple terms, to make it easier for you to create measures in DAX.
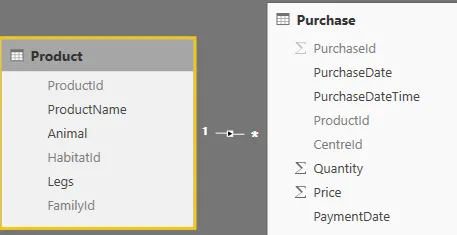
We'll assume that you have the following oh-so-simple database:
To understand filter context let's start with a simple set of data: two tables joined by a common field.
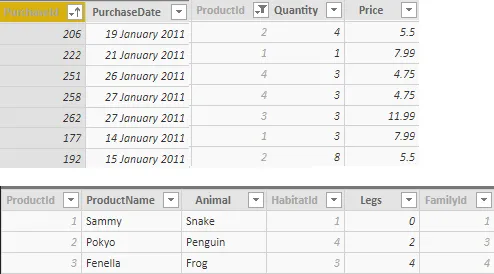
The Product table contains the names of cuddly toys, while the Purchase table contains the individual sales of those toys:
Using Sammy Snake's ProductId of 1 it is possible to find all of the dates on which they have been sold in the Purchase table.
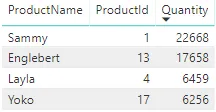
In fact the action of using one value to filter another table is almost what filter context is. Consider this table visual, with a simple measure summing quantity sold:
While Power BI could show each individual transaction that Sammy was involved in, this would be impractical. Instead aggregation occurs.
How does Power BI know which rows to aggregate though? The answer: filter context. For each row in the visual there is a different version of the Purchase table:
Using the relationship between the Product and Purchase tables the rows are all removed until only rows for ProductId 1 (Sammy the snake) are left; then all the rows left over are aggregated.
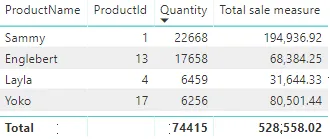
This same process occurs when the calculation is more complicated, such as when aggregating an expression. For example working out a total sale price:
Instead of a simple addition of all the rows remaining, this time the table is filtered to only include Sammy sales. Then two columns interact before summing the result.
This is a virtual representation of what that table would look like for Sammy:
For each product this table would be generated (so there would be one table for Yoko the Yak, one for Englbert the Elephant, etc).
Then the aggregation would work over this table as if it actually existed (in this case applying the SUM function). The resulting answer would be returned for each row in the original visual like this:
For the total, the virtual table would contain all of the purchases.
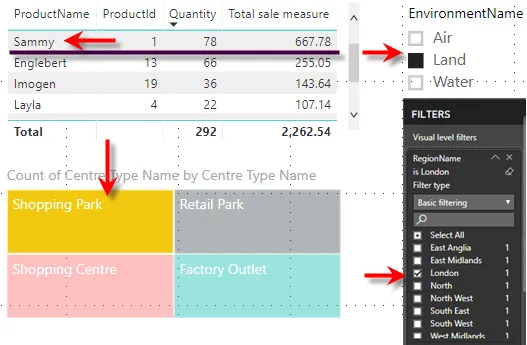
These filters can come from a multitude of different places Consider this picture:
Although it is rather crowded, several filters are affecting the underlined record.
There at least 4 filters: the ProductName row, CentreType cross highlighting, EnvironmentName slicer and a RegionName visual level filter. That isn't even close to the maximum number of ways in which you can filter a visual!
Measures automatically have filter context but calculated columns don't. Instead they have row context (which is the topic of another blog).
What happens then when we try and use one of these aggregate functions to create a calculated column?
Let's assume that you have created this simple calculated column.
The column gets created but alas something has gone "wrong":
Whilst the company would be happy with these sale figures, they seem unlikely!
Unlike with a measure in a visual, calculated columns don't have filter context applied. Instead we need to introduce it by using a new function:
CALCULATE is an all powerful function which is almost synonymous with filter context. It can be used to introduce or change the filter context applied to a row.
Instead of summing the Purchase table as a whole, it is now performing that function for each product, leading to the Purchase table being filtered for the current row's sales:
CALCULATE is such a useful function that it will be the subject of its own blog!
There you have it: filter context in a nutshell, applying any filters on the current calculation based on its position in a visual or on other external factors.
Some other pages relevant to the above blog include:
Kingsmoor House
Railway Street
GLOSSOP
SK13 2AA
Landmark Offices
99 Bishopsgate
LONDON
EC2M 3XD
Holiday Inn
25 Aytoun Street
MANCHESTER
M1 3AE
© Wise Owl Business Solutions Ltd 2024. All Rights Reserved.