Read our blogs, tips and tutorials
Try our exercises or test your skills
Watch our tutorial videos or shorts
Take a self-paced course
Read our recent newsletters
License our courseware
Book expert consultancy
Buy our publications
Get help in using our site
547 attributed reviews in the last 3 years
Refreshingly small course sizes
Outstandingly good courseware
Whizzy online classrooms
Wise Owl trainers only (no freelancers)
Almost no cancellations
We have genuine integrity
We invoice after training
Review 30+ years of Wise Owl
View our top 100 clients
Search our website
We also send out useful tips in a monthly email newsletter ...
Splitting long tables of data into different pages (pagination) |
---|
This blog shows how you can split rows in tables into different pages, making the data easier to read. |
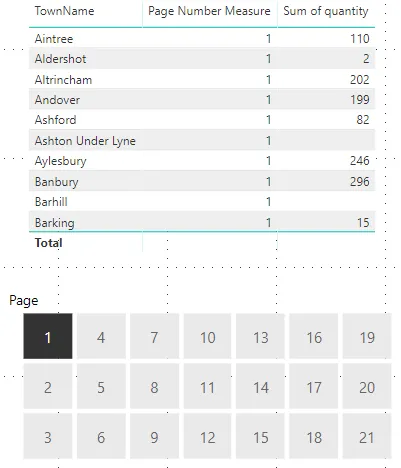
When there is loads of data in a table, it can be overwhelming to look at. This can lead to data being missed. Breaking the data into smaller chunks makes it more manageable:
Page 1 of the town sales table.
This blog goes through the steps you'll need to follow to create the pagination effect above.
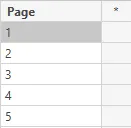
The first thing to do is to create a table containing the page numbers you want to use. Click on the Enter Data option on the Home tab, call your table Page List and add as many rows as you will require pages for:
The easiest way to work this out is to divide the number of rows in the table by the number of rows you want per page. The Town table has 203 rows, which at 10 rows per page gives 21 pages.
Highlight the Page field and use the Modelling tab to turn it into text:
Text fields make for a much better looking slicer.
That is the easy part done and already you can make the slicer in the above picture. No relationships between the tables are required!
The next thing to do is to number the rows (in our case, the towns). Here's one way to do this:
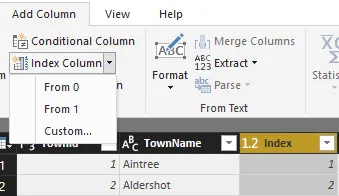
In Query Editor go to the Add Column tab and click Index Column. Choose From 1 as From 0 will cause extra problems.
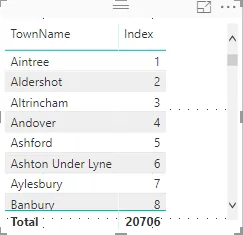
This will generate a unique list of numbers 1 to N for each town. Doing it in the query editor means any time the data is reloaded, the index will be redone.
The problem with this index (and indeed any calculated column) is that it is static. Adding a filter into the mix (for example, to show only towns in a particular region) will mess up my numbering.
Because of this problem, we will create our own numbering using a measure. To do this we need to create a temporary filtered table for each row of the table:
ALLSELECTED returns the town table filtered by external sources (such as slicers). FILTER takes this table and removes any towns which have a higher index number than the current row. CALCULATE then counts how many rows are left in the FILTERED table.
Here are three tables filtered to reflect what is going on for the Aylesbury row (index number 7):
On the left is the Town table filtered by external sources (in this case, a region slicer). This table is then filtered to show all Index numbers less than or including Aylesbury (7) (the middle table). The number of towns left are counted and assigned to Aylesbury as its row (4).
This gives us a visual row number which will change depending on the filters and slicers used on the table.
You can now use this row number measure to calculate page numbers:
This will be different depending on how many rows you want per page. I want 10 rows per page, so I divide the row number by 10 and then use CEILING to round up to the first whole number (i.e 0.1 becomes 1).
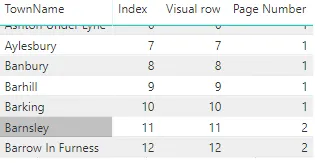
My table now looks like this:
There are currently no filters for this table (hence why the Index and Visual row are the same).
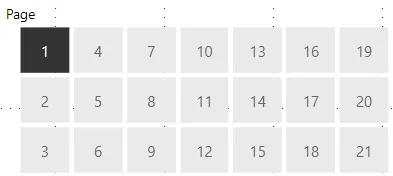
Now we want to create the slicer and link it to our Page Number measure. Use the Page column to create a slicer:
In the format section of the slicer under General set Orientation to Horizontal to get this slicer format.
We can test if a value in the slicer has been checked by testing which values are still available in the Page List table:
The FORMAT function converts the Page Number into text. The formula then checks if this text exists in the Page List table (if anything on the slicer has been checked it will be in the table).
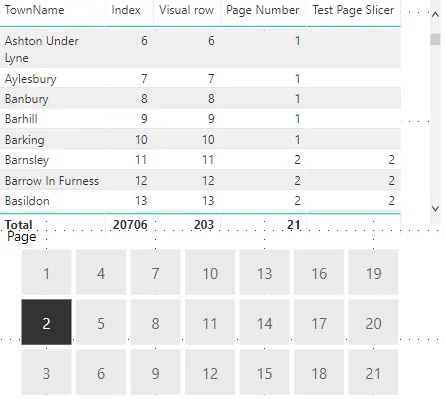
If the Page Number is present in the Page List table, then it will be returned in the measure; otherwise it won't be returned:
When page 2 in the slicer is ticked, the page numbers in the Test Page Slicer measure are only returned if they are 2.
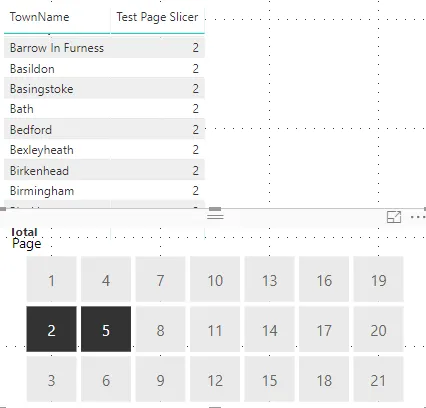
If I remove all of the columns apart from TownName and Test Page Slicer then this is what it looks like:
Only rows that were on the ticked pages are returned.
Now if I want to return the units sold in these towns all I need to do is create a final measure:
As long as a value is returned from Test Page Slicer then we want the sum of quantity. If a value is not returned it hasn't been ticked, therefore we want nothing!
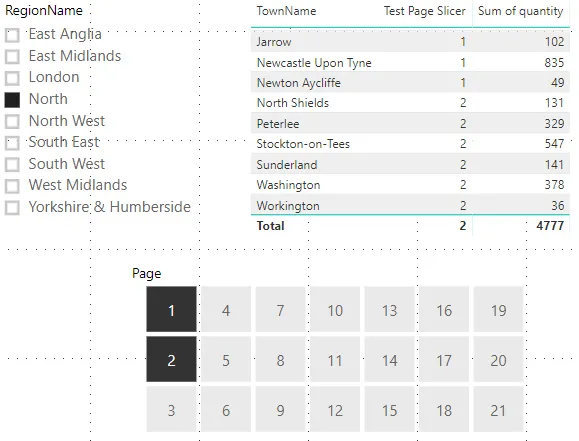
After all that we now have all our data on different pages within the same visual, and it can be filtered by other slicers:
These are the sales for towns in the North on pages 1 and 2.
We do have to include Test Page Slicer in the visual, but you can set the column width to invisible and turn Word Wrap off:
Just drag the column width to make it small like you would in Excel. Set Column Headers word wrap to off in the format window.
We did that function in loads of separate measures, but the truth is you could have done it in one:
Although I think we can agree that for learning it the other way was easier! Now all you need is an index number in each table you want the pagination in. Also remember to update the Sum of Quantity measure to All in one rather than Test Page Slicer.
If you want to see this report click here.
Some other pages relevant to the above blog include:
Kingsmoor House
Railway Street
GLOSSOP
SK13 2AA
Landmark Offices
99 Bishopsgate
LONDON
EC2M 3XD
Holiday Inn
25 Aytoun Street
MANCHESTER
M1 3AE
© Wise Owl Business Solutions Ltd 2024. All Rights Reserved.