Read our blogs, tips and tutorials
Try our exercises or test your skills
Watch our tutorial videos or shorts
Take a self-paced course
Read our recent newsletters
License our courseware
Book expert consultancy
Buy our publications
Get help in using our site
559 attributed reviews in the last 3 years
Refreshingly small course sizes
Outstandingly good courseware
Whizzy online classrooms
Wise Owl trainers only (no freelancers)
Almost no cancellations
We have genuine integrity
We invoice after training
Review 30+ years of Wise Owl
View our top 100 clients
Search our website
We also send out useful tips in a monthly email newsletter ...
Weighted and numeric distribution in Power BI Desktop |
---|
Learn to use the SUMMARIZE and CALCULATE functions to produce numeric and weighted distributions. |
For my (fictitious!) sales company, I would like to calculate the number of stores each product has sold in, then work out the percentage that product makes up of all the sales in those stores.
The world of cuddly toys is pretty cut throat....
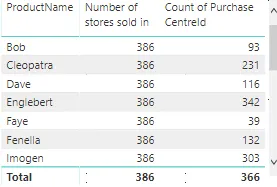
First up is to work out the number of stores my products each sold in. To do this create a table visual, then count the CentreID field in the tblCentre table and count distinct the CentreID field in the tblPurchase table.
Interestingly this results in two different results. The tblCentre table's Centreid field is returning a count of ALL the centres. rather than the count of stores that have sold something.
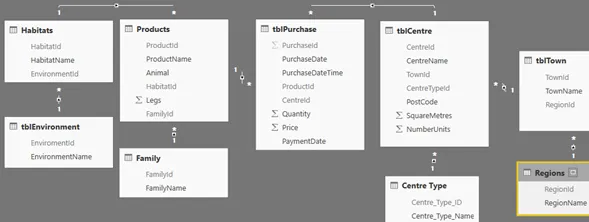
This is caused by the direction of filtering. We want to use the product table to filter the centre table but that would be going against the relationship flow:
The products table and centre tables can filter the purchase table. They can't currently filter each other.
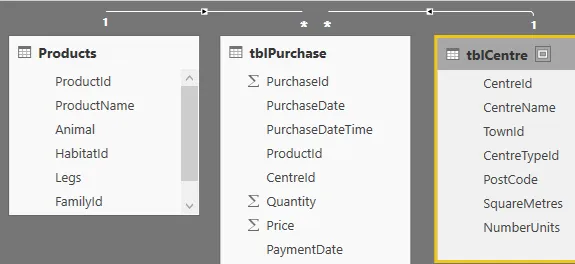
Double click on the relationship you want to change. For this example I want the Products table to filter the Centre table so I double click the Purchase/Centre relationship.
This will open the relationship window. Change the Cross filter direction to Both to allow the Purchase table to filter the Centre table.
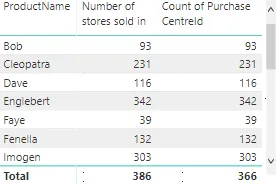
Now you should have the same product results for both columns of your table. Note the totals are different due to some stores selling no products:
We will need this relationship for later when calculating the weighted distribution.
Next I want a quantity sold total for each product that will not be affected by any external filters. To do this I will need a measure like this:
CALCULATE replaces filters applied to the expression with ones you specify. ALLEXCEPT stops the product filter applied on the row from being removed.
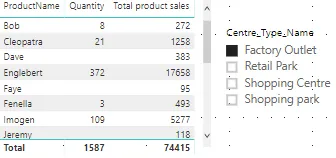
So now I have a quantity for each product that can be filtered using slicers or filters, and another which stays the same.
Bob has sold 272 units of which 8 were in a Factory Outlet store.
Now we can calculate the Numeric Distribution by dividing the number of stores the product sold in by the total number of stores:
Divide the number of stores the product is sold in (filtered by the row) by the total number of stores. All replaces the row filter and returns all the CentreIDs.
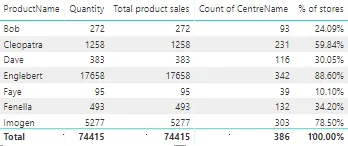
We can now see the numeric distribution of each product (how many stores they are in/how many they could be in) :
Bob is sold in 93 stores out of a possible 386 making up a measly 24% coverage!
Now to work out the total units sold for all products in the stores each product is sold in. For example: Bob has sold 272 units in 93 stores; how many units total were sold in those stores?
This looks the way to go - sum the quantity sold for all the products.
Sadly this doesn't work and instead returns a total for all the products for all the stores:
The same has happened as we saw previously - Power BI has replaced the row filters.
We need to retain the filter that has been applied to the CentreTable by each product. To do this we can use the SUMMARIZE function to create a table.
SUMMARIZE needs a table and at least one existing column, then a name for any new columns you want to create by grouping a measure to every row of the first column.
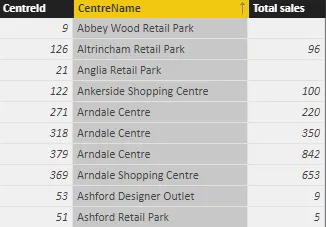
SUMMARIZE will have created a new table with a column showing the total products sold for each shop. This in itself is no use as it would return the same values every time:
Since there are no filters on the Centre table at this point the results column is just the units sold in each store.
Instead we need to create this table (virtually) for each product, then sum that column, giiving us all the units sold in stores that each product is sold in:
We can pass the table into SUMX and choose the column we created [Total sales] to return the total sales in each store.
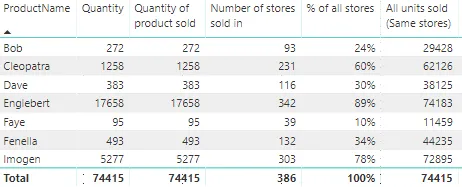
Add that to your table visual and it should looking something like this:
We can now work out how Bob did compared to the rests of the products in his stores.
The last things to do is fairly straightforward: divide the the individual product's sales by the total sales in all their stores:
You could retype the entire SUMX(SUMMARIZE) calculation again, but it's much easier to refer to the measure we just made.
There you have it folks - the weighted and numeric distributions for the Make-a-Mammal company!
You can see what the resulting Numeric and Weighted Distribution Report looks like by following the aforementioned link.
Some other pages relevant to the above blog include:
Kingsmoor House
Railway Street
GLOSSOP
SK13 2AA
Landmark Offices
99 Bishopsgate
LONDON
EC2M 3XD
Holiday Inn
25 Aytoun Street
MANCHESTER
M1 3AE
© Wise Owl Business Solutions Ltd 2024. All Rights Reserved.