Read our blogs, tips and tutorials
Try our exercises or test your skills
Watch our tutorial videos or shorts
Take a self-paced course
Read our recent newsletters
License our courseware
Book expert consultancy
Buy our publications
Get help in using our site
471 attributed reviews in the last 3 years
Refreshingly small course sizes
Outstandingly good courseware
Whizzy online classrooms
Wise Owl trainers only (no freelancers)
Almost no cancellations
We have genuine integrity
We invoice after training
Review 30+ years of Wise Owl
View our top 100 clients
Search our website
We also send out useful tips in a monthly email newsletter ...
An introduction to using matplotlib in Python to create charts Part two of a six-part series of blogs |
---|
If you want to create charts in Python, the chances are that you'll do it using the matplotlib module. This blog will get you started and explain some of its foibles!
|
In this blog
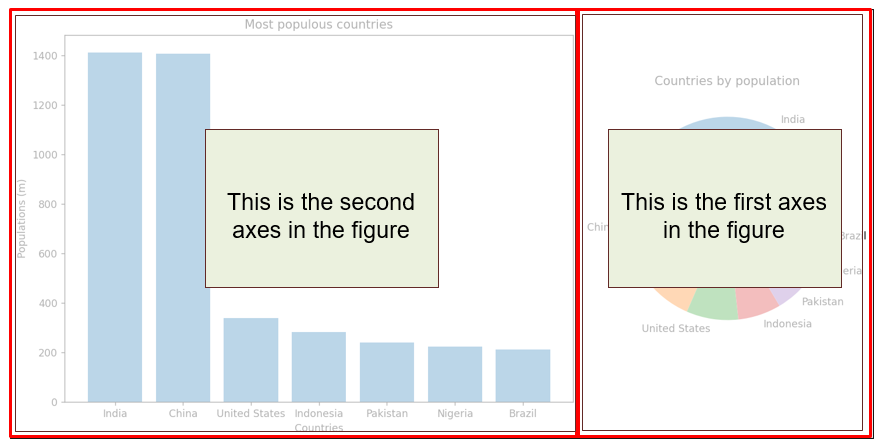
Nearly all Python programmers use explicit references to create objects for each chart they are building. Usually these objects consist of a single figure containing one or more subplots, each of which can contain multiple axes:
This figure contains a subplot consisting of one row and two (unequal) columns, and hence two axes (or charts).
Here are the words that matplotlib uses to describe bits of charts like the one shown above. I've included the words they should have used too!
Word | What it describes | What it should have been called |
---|---|---|
Figure | The container for all of the subplots you're creating | Canvas |
Subplot | A container for multiple charts | Subplot is fine! |
Axes | A single chart within a subplot | Anything but this! Chart? Graph? |
What were the authors of matplotlib thinking when they chose to call charts axes?
My award for the worst name-giver in computing would go to the person who gave the name Power Automate to two completely different Microsoft applicatons, but the person who called charts "axes" would be a close runner-up on my podium.
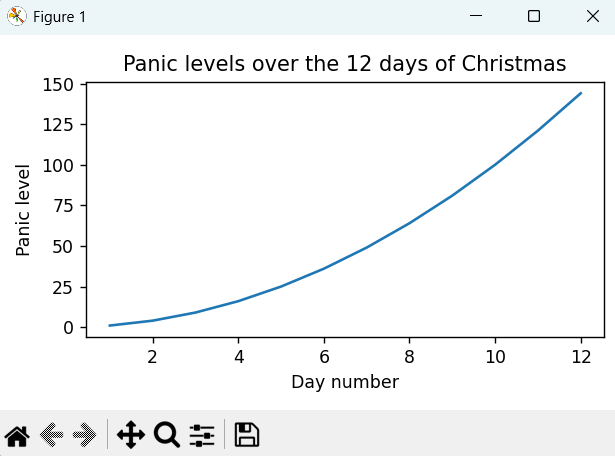
Let's reproduce the chart from the previous part of this blog, but this time use an explicit reference to the chart (ahem, "axes") object:
We'll reproduce pretty much the same chart, as above.
Here's the code to do this:
import numpy as np
import matplotlib.pyplot as plt
# get the number of days of Xmas ( 1 to 12)
days_till_xmas = np.arange(1,13)
# panic levels increase exponentially
panic_level = days_till_xmas ** 2
# create a single chart within a subplot
fig, ax = plt.subplots(figsize = (5,3))
# customise this chart, now known as "ax"
ax.plot(days_till_xmas,panic_level)
# add a title
ax.set_title('Panic levels over the 12 days of Christmas')
# label the axes
ax.set_ylabel("Panic level")
ax.set_xlabel("Day number")
# space this out
fig.tight_layout()
# show the chart on screen
plt.show()
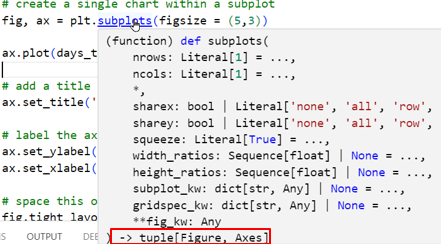
There are two things worth pointing out in this. The first is that we unpack the two things returned from subplots:
The subplots function returns a tuple containing the canvas containing your charts (the "figure") and a collection of the charts within it.
Our code would have been identical (if slighly longer) if we'd written this instead:
# create a single chart within a subplot
things_returned = plt.subplots(figsize = (5,3))
# get each of the two things returned
fig = things_returned[0]
ax = things_returned[1]
One very good reason not to spell out what youi're doing like this is that ... nobody else does.
The other thing to point out is that (as a general rule) you change from implicit to explicit formatting by adding set_ in front of formatting commands. Compare the implicit way:
# add a title
plt.title('Panic levels over the 12 days of Christmas')
# label the axes
plt.ylabel("Panic level")
plt.xlabel("Day number")
With the explicit way:
# add a title
ax.set_title('Panic levels over the 12 days of Christmas')
# label the axes
ax.set_ylabel("Panic level")
ax.set_xlabel("Day number")
So the functionality is the same, but the commands are slightly different.
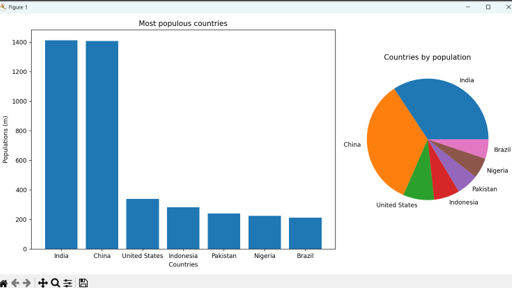
The great advantage of subplots is that they can contain more than one chart - like this, in fact:
A column chart taking up a wide column followed by a pie chart taking up the other (narrower) column.
You can use subplots to create multiple charts which share axes using the sharex and sharey keyword, although this blog doesn't cover this.
Here's how to create these charts:
import numpy as np
import matplotlib.pyplot as plt
# Wikipedia list of most populous countries in the world
countries = ["India","China","United States","Indonesia",
"Pakistan","Nigeria","Brazil"]
populations = [1413,1408,340,282,241,224,213]
# create a chart based on these countries amd figures
fig, (ax1,ax2) = plt.subplots(
nrows = 1,
ncols = 2,
figsize = (12,6),
gridspec_kw= {'width_ratios':[2,1]}
)
# create and format the bar chart on the left
ax1.bar(countries,populations)
ax1.set_title("Most populous countries")
ax1.set_xlabel("Countries")
ax1.set_ylabel("Populations (m)")
# create and format the pie chart on the right
ax2.pie(populations, labels = countries)
ax2.set_title("Countries by population")
# make things fit in better
fig.tight_layout()
plt.show()
The arguments to the subplots function above are as follows:
Argument | Value | What it denotes |
---|---|---|
nrows | 1 | There will be one row of charts |
ncols | 2 | There will be two columns |
figsize | (12,6) | The total canvas will be twice as wide as it is high |
gridspec_kw | {'width_ratios':[2,1]} | A single-item dictionary setting the first column to be twice the width of the second column |
If you're wondering how I found out about the gridspec_kw argument, it's the same way as you will: Googling, taking examples from the matplotlib website and using AI tools like ChatGPT!
Parts of this blog |
---|
|
Some other pages relevant to the above blogs include:
Kingsmoor House
Railway Street
GLOSSOP
SK13 2AA
Landmark Offices
99 Bishopsgate
LONDON
EC2M 3XD
Holiday Inn
25 Aytoun Street
MANCHESTER
M1 3AE
© Wise Owl Business Solutions Ltd 2025. All Rights Reserved.