Read our blogs, tips and tutorials
Try our exercises or test your skills
Watch our tutorial videos or shorts
Take a self-paced course
Read our recent newsletters
License our courseware
Book expert consultancy
Buy our publications
Get help in using our site
471 attributed reviews in the last 3 years
Refreshingly small course sizes
Outstandingly good courseware
Whizzy online classrooms
Wise Owl trainers only (no freelancers)
Almost no cancellations
We have genuine integrity
We invoice after training
Review 30+ years of Wise Owl
View our top 100 clients
Search our website
We also send out useful tips in a monthly email newsletter ...
An introduction to using matplotlib in Python to create charts Part six of a six-part series of blogs |
---|
If you want to create charts in Python, the chances are that you'll do it using the matplotlib module. This blog will get you started and explain some of its foibles!
|
To avoid re-inventing wheels I'd strongly recommend creating styles to manage your Python chart fromatting.
This recommendation assumes that you are going to be working with charts a fair bit. It isn't worth investing in learning styles if you're just going to be creating a few ad hoc charts.
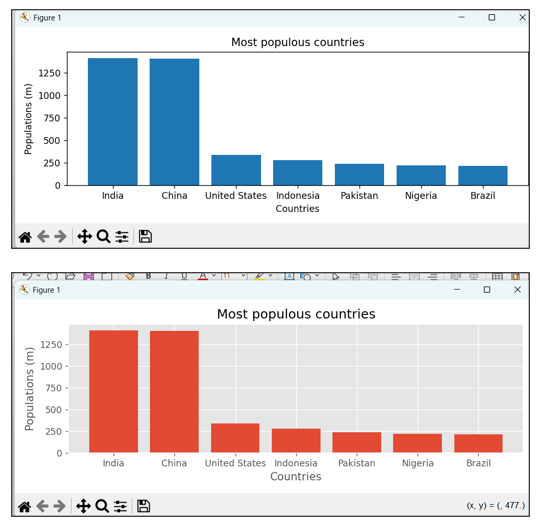
Styles make a big difference to a chart. Consider these two examples:
Two identical charts, except that the bottom one has had the ggplot style applied to it.
Here's how to apply a style like this:
import numpy as np
import matplotlib.pyplot as plt
# Wikipedia list of most populous countries in the world
countries = ["India","China","United States","Indonesia",
"Pakistan","Nigeria","Brazil"]
populations = [1413,1408,340,282,241,224,213]
# apply a style
plt.style.use('ggplot')
# create a chart based on these countries amd figures
fig, ax = plt.subplots(figsize = (8,3))
# create and format the bar chart on the left
ax.bar(countries,populations)
ax.set_title("Most populous countries")
ax.set_xlabel("Countries")
ax.set_ylabel("Populations (m)")
# make things fit in better
fig.tight_layout()
plt.show()
You seem to have to apply styles before you do any charting. You can list out all of the built-in styles available like this:
import matplotlib.pyplot as plt
# list out the styles available
print(plt.style.available)
On my laptop, here's the list of styles I get:
['Solarize_Light2', '_classic_test_patch', '_mpl-gallery', '_mpl-gallery-nogrid', 'bmh', 'classic', 'dark_background', 'fast', 'fivethirtyeight', 'ggplot', 'grayscale', 'petroff10', 'seaborn-v0_8', 'seaborn-v0_8-bright', 'seaborn-v0_8-colorblind', 'seaborn-v0_8-dark', 'seaborn-v0_8-dark-palette', 'seaborn-v0_8-darkgrid', 'seaborn-v0_8-deep', 'seaborn-v0_8-muted', 'seaborn-v0_8-notebook', 'seaborn-v0_8-paper', 'seaborn-v0_8-pastel', 'seaborn-v0_8-poster', 'seaborn-v0_8-talk', 'seaborn-v0_8-ticks', 'seaborn-v0_8-white', 'seaborn-v0_8-whitegrid', 'tableau-colorblind10']
The ggplot style is a popular choice because it tries to emulate ggplot, a popualr plotting package for R.
It's easy in Python to create a custom matplotlib style. The hard thing (which we'll consider below) is working out what the style should contain!
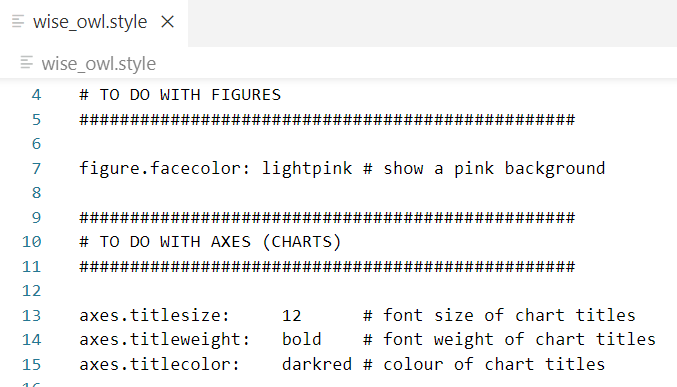
Here's a typical (if very simple) style sheet you could create:
This simple file (I've called it wise_owl.style, but you could use any file name) will customise the appearance of any chart to which it's applied.
Here's how you could apply this:
import numpy as np
import matplotlib.pyplot as plt
# Wikipedia list of most populous countries in the world
countries = ["India","China","United States","Indonesia",
"Pakistan","Nigeria","Brazil"]
populations = [1413,1408,340,282,241,224,213]
# apply custom Wise Owl style
plt.style.use('c:/wiseowl/wise_owl.style')
# create a chart based on these countries amd figures
fig, ax = plt.subplots(figsize = (8,3))
# create and format the bar chart on the left
ax.bar(countries,populations)
ax.set_title("Most populous countries")
ax.set_xlabel("Countries")
ax.set_ylabel("Populations (m)")
# make things fit in better
fig.tight_layout()
plt.show()
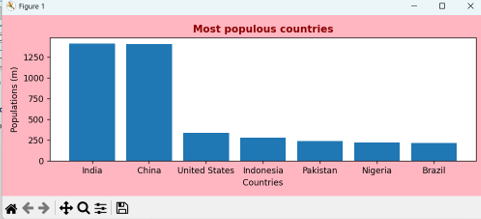
And here's what this code would produce:
The figure background is pink, and the chart title is in bold, dark red and slightly bigger.
So creating and applying matplotlib styles is easy - but what should they contain?
The easiest way to create styles is to copy code from the matplotlib template containing all of the possible formatting instructions that you can use. To see where this is, run this code:
import matplotlib
# show the location of the matplotlib
# runtime configuration file
print(matplotlib.matplotlib_fname())
This will give you something like this (I've edited this a bit to preserve confidentiality):
C:\Users\olly.owl\AppData\Local\Packages\PythonSoftwareFoundation.Python.3.13_qbzdf2kfra8p0\LocalCache\local-packages\Python313\site-packages\matplotlib\mpl-data\matplotlibrc
You can then paste this into your Explorer address bar:
Paste in the full file path and name.
This will let you edit this in any application, such as Visual Studio Code:
Your list of applications will be different to this (and probably shorter!).
You can then copy any of the 814 lines (for my version) from this file to create your own customised style sheet.
Don't forget to remove the # symbol from the start of each line that you want to include. You can also add your own comments, as I've done in the example earlier on this page.
Parts of this blog |
---|
|
Some other pages relevant to the above blogs include:
Kingsmoor House
Railway Street
GLOSSOP
SK13 2AA
Landmark Offices
99 Bishopsgate
LONDON
EC2M 3XD
Holiday Inn
25 Aytoun Street
MANCHESTER
M1 3AE
© Wise Owl Business Solutions Ltd 2025. All Rights Reserved.