Read our blogs, tips and tutorials
Try our exercises or test your skills
Watch our tutorial videos or shorts
Take a self-paced course
Read our recent newsletters
License our courseware
Book expert consultancy
Buy our publications
Get help in using our site
471 attributed reviews in the last 3 years
Refreshingly small course sizes
Outstandingly good courseware
Whizzy online classrooms
Wise Owl trainers only (no freelancers)
Almost no cancellations
We have genuine integrity
We invoice after training
Review 30+ years of Wise Owl
View our top 100 clients
Search our website
We also send out useful tips in a monthly email newsletter ...
An introduction to using matplotlib in Python to create charts Part one of a six-part series of blogs |
---|
If you want to create charts in Python, the chances are that you'll do it using the matplotlib module. This blog will get you started and explain some of its foibles!
|
In this blog
This series of blogs explains (with inimitable Wise Owl clarity) how to get started with matplotlib, the go-to module in Python for creating charts.
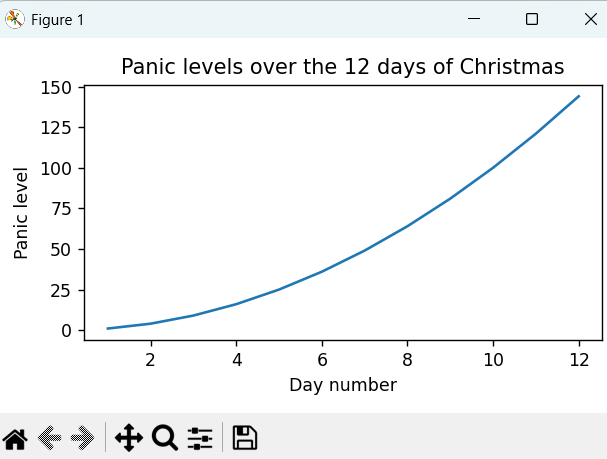
A simple matplotlib chart, with minimal formatting.
Sadly the word matplotlib is written entirely in lower case. The module was created to behave like the MatLab statistical programming environment (you can see some history explaining why, when and how matplotlib was written here).
Matplotlib isn't the only charting module that you can use in Python. Here are some alternatives (presented here in approximate descending order of popularity and use):
Alternative | Notes |
---|---|
Seaborn is based upon matplotlib, but offers a higher-level programming environment (ie it has simpler syntax) | |
Plotly allows you to zoom in on charts and hover over them (it is more interactive than matplotlib) | |
Bokeh is a good choice if your main focus is on creating interactive charts for web apps | |
Altair has a more concise syntax than matplotlib, but is not as powerful | |
Plotnine (or ggplot, a similar variant) are most suitable for users of R |
However matplotlib is the de facto charting standard for Python, and if there's one thing I've learned in computing it's that it's nearly always a good idea to follow the herd!
Before you can use matplotlib, you first need to install it! Here's how to do this from the Visual Studio Code terminal window:
python -m pip install matplotlib
If you haven't already installed NumPy this will add it, since matplotlib is designed to chart data from NumPy arrays (if you don't know NumPy or Pandas you'll probably struggle learning matplotlib, since so many of the online examples assume knowledge of one or other of these two modules).
Your programs will then need to reference matplotlib (and probably NumPy too):
import numpy as np
import matplotlib.pyplot as plt
If (like me) you are wondering what's in the rest of the matplotlib library, the answer is that the pyplot module provides a "convenient wrapper that simplifies access" to the rest of the functionality in the matplotlib library (I admit I'm quoting ChatGPT for this).
Here's a Python program to create the basic chart shown at the top of this page:
import numpy as np
import matplotlib.pyplot as plt
# get the number of days of Xmas ( 1 to 12)
days_till_xmas = np.arange(1,13)
# panic levels increase exponentially
panic_level = days_till_xmas ** 2
# chart panic level against days till Xmas
plt.plot(days_till_xmas,panic_level)
# add a title
plt.title('Panic levels over the 12 days of Christmas')
# label the axes
plt.ylabel("Panic level")
plt.xlabel("Day number")
# show the chart on screen
plt.show()
The program creates a line chart (that's what the plot method does) of my panic level against the 12 days of Christmas. Here's what the two arrays being charted look like:
The arrays giving the X axis labels and the data we're charting against each of these labels.
However this way of creating charts uses implicit references (at no point can we refer to the properties and methods of the line chart directly). It's time now to turn to using explicit references, and learn about figures, subplots and axes.
Parts of this blog |
---|
|
Some other pages relevant to the above blogs include:
Kingsmoor House
Railway Street
GLOSSOP
SK13 2AA
Landmark Offices
99 Bishopsgate
LONDON
EC2M 3XD
Holiday Inn
25 Aytoun Street
MANCHESTER
M1 3AE
© Wise Owl Business Solutions Ltd 2025. All Rights Reserved.