Read our blogs, tips and tutorials
Try our exercises or test your skills
Watch our tutorial videos
Catch up on one of our webinars
Take a self-paced course
Read our recent newsletters
License our courseware
Book expert consultancy
Buy our publications
Get help in using our site
394 attributed reviews in the last 3 years
Refreshingly small course sizes
Outstandingly good courseware
Whizzy online classrooms
Wise Owl trainers only (no freelancers)
Almost no cancellations
We have genuine integrity
We invoice after training
Review 30+ years of Wise Owl
View our top 100 clients
Search our website
We also send out useful tips in a monthly email newsletter ...

Some other pages relevant to this blog include:
You can also book hourly online consultancy for your time zone with one of our 7 expert trainers!
| Power BI Azure Maps: How to find and filter reference layers |
|---|
| Finding the perfect reference layer to use in Power BI can be a pain. This blog covers how to use the Geo Portal to find a map and then filter it down to relevant information. |
In this blog
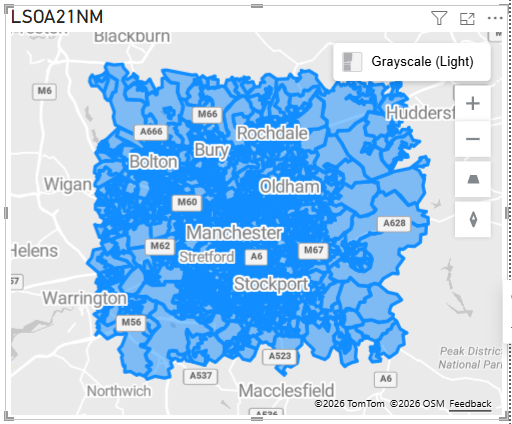
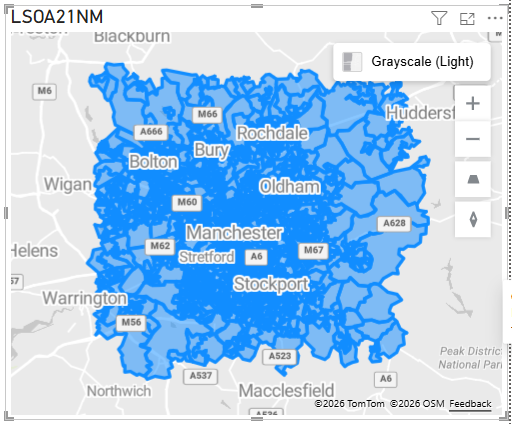
In the Azure map visual in Power BI you can add a reference layer to provide detailed information about regions in the map. In the example below, I've added a reference layer to show census boundaries in the UK:

The Azure maps ability to host reference layers is fantastic but finding those layers can be a nightmare! In this blog I'll show you how to find and download map data and apply it as a reference layer to an Azure map.
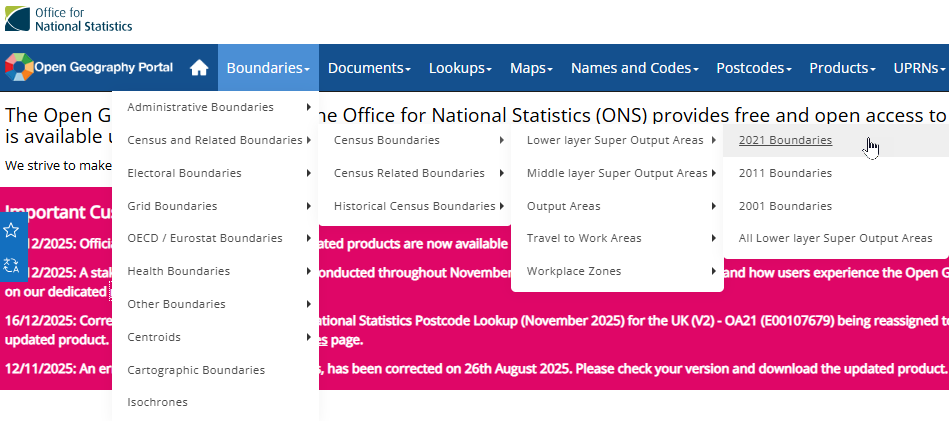
The Open Geography Portal is a great source of data and reference layers to choose from.

For this blog, I'm going with the Census and Related Boundaries | Census Boundaries | Lower layer Super Output Areas | 2021 Boundaries map.
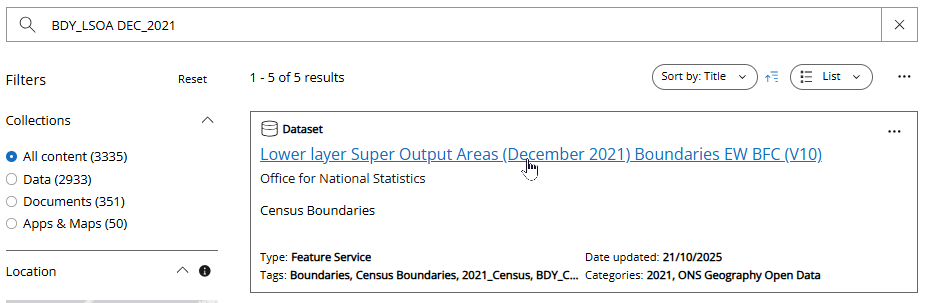
Click the name of the map that you are interested in to view it, there are normally several older versions available.

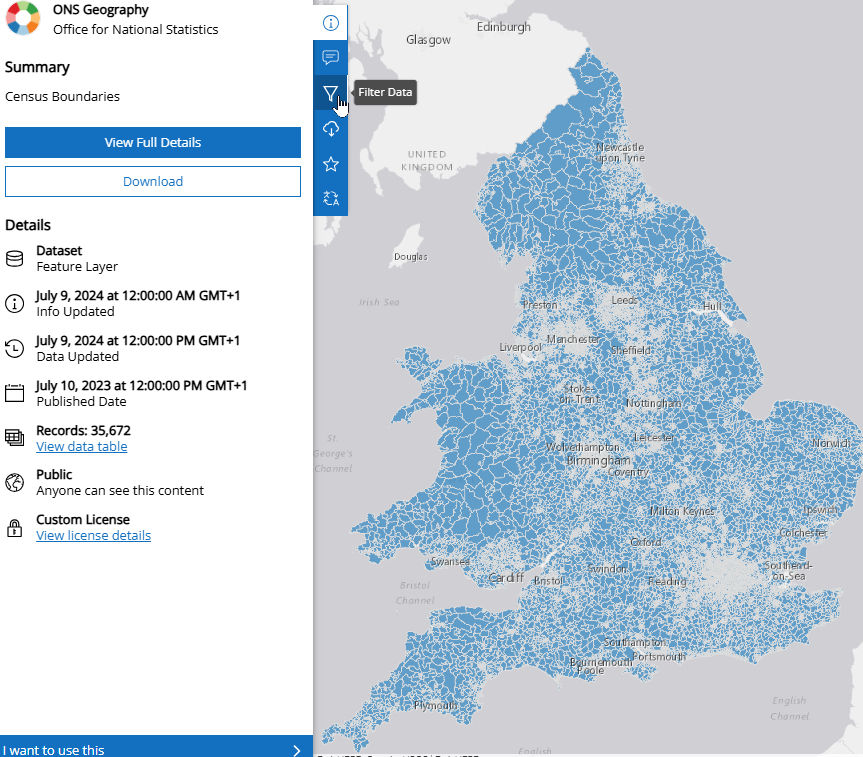
This map covers census boundaries data within the UK.
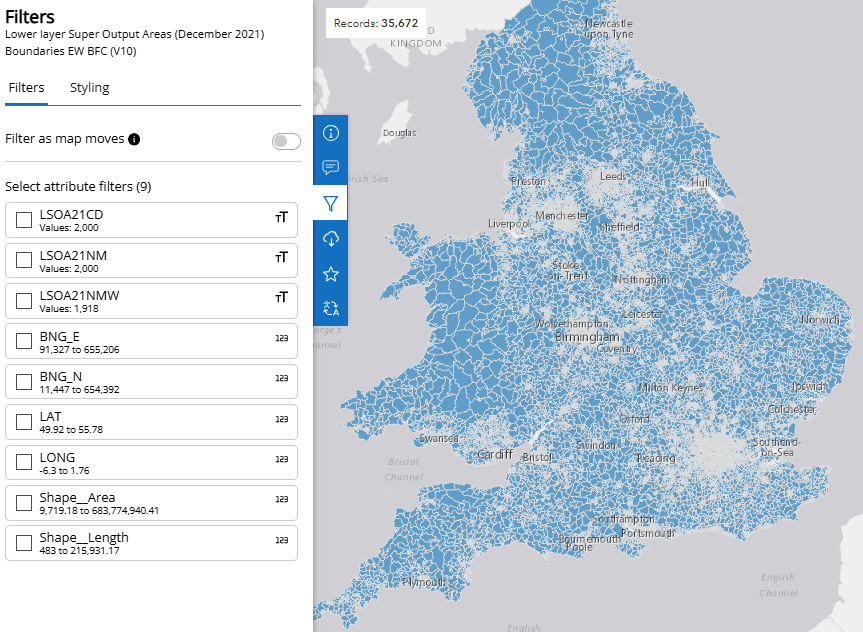
The website will load a preview of the map so that you can see the data it contains.

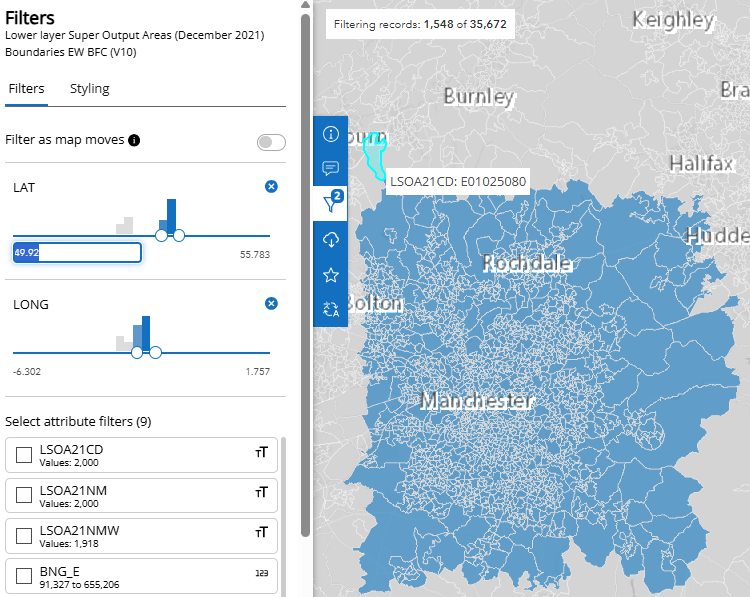
The Filters pane on the left-hand side of the screen allows you to select the parts of the map you want to keep.
You can apply filters to a map to reduce the amount of data you'll download.
In the diagram below I can see the entire UK, but that's a bit much! I'd like to focus on the Greater Manchester area.
On the right hand side of the Filters pane, click the funnel icon to apply a filter.

Azure Maps supports 30,000 data points and this dataset has 35,672, argh!
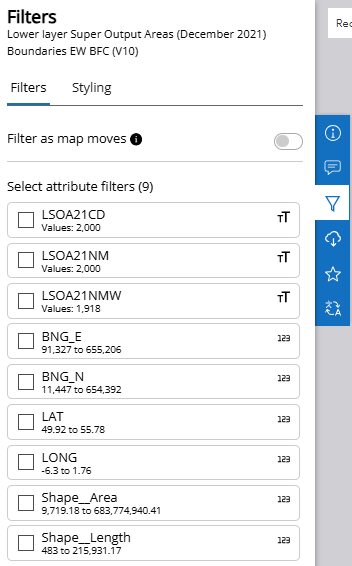
Choose which fields you would like to use in the filter by checking boxes in the Select attribute filters list.

The available filters are determined by the columns in the linked dataset.
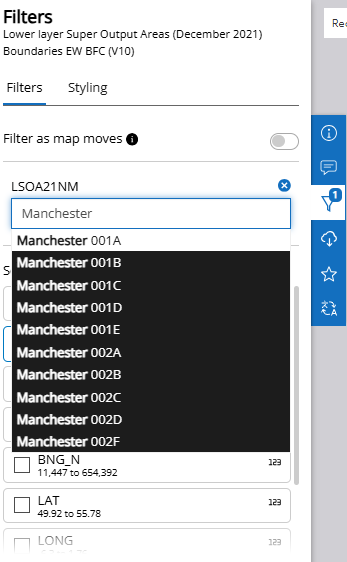
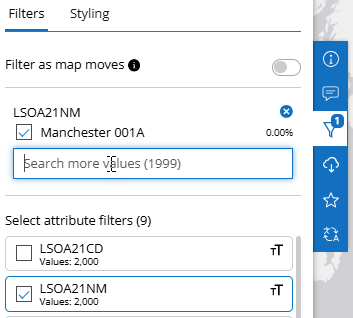
To filter by the name of a region, check the box next to LSOA21NM and then type the region name in the search box.

The contents of the selected column will appear in the list below, which will automatically filter as you type.
If you have lots of regions to add, filtering by the name would take a long time as you can only add one at a time.

Names work best on smaller data sets.
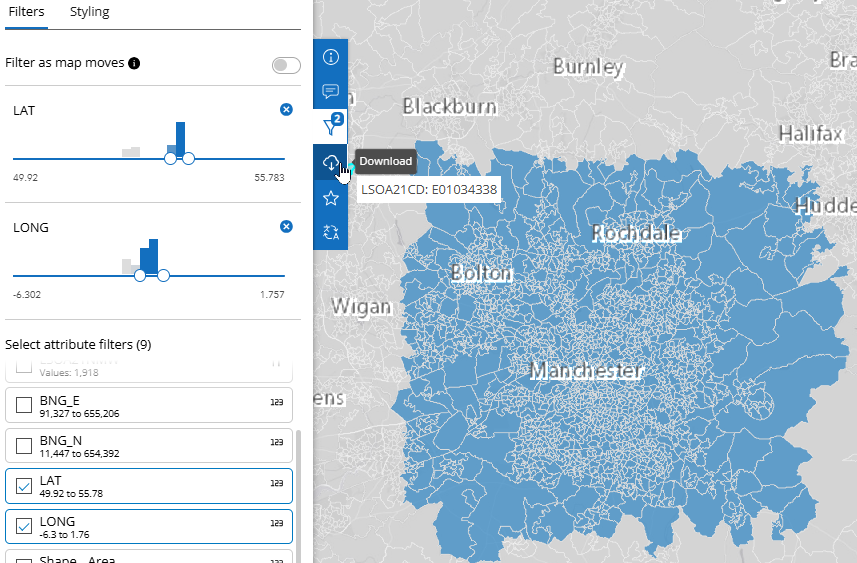
It's quicker to filter using the Lat and Long properties, either by using the sliders or entering the values directly.

Dragging the slider will update the map in real time, making it easier to choose the right area.
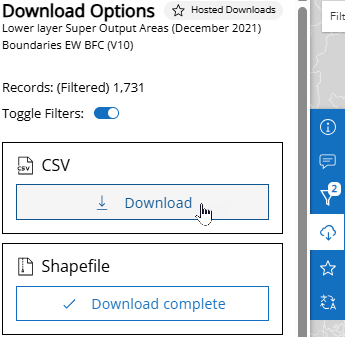
After applying your filters, you can download the map by clicking on the download button beneath the filter icon.

Bookmark the page if you don't want to recreate filters, especially if you entered them by hand!
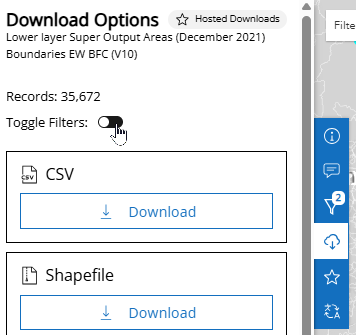
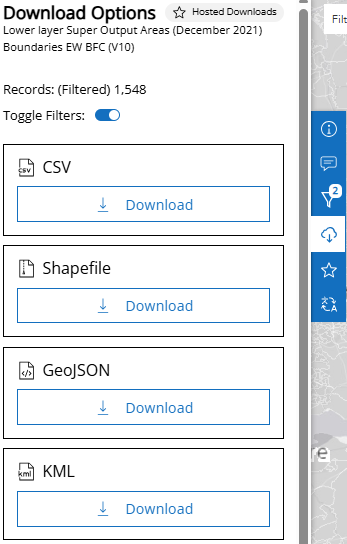
On the next page, it will default to downloading the entire dataset, not your filtered version. Click the Toggle Filters option to apply the filters you've created.

Make sure to toggle the filters back on!
You can download the geometry data for the map in a variety of formats. For this example, we'll use the Shapefile format which returns a .zip file type. Click the Download button in the Shapefile box to download it.

Other supported options include GeoJSON, KML and CSV.
We also need the CSV file containing the data we will visualise. Click the Download button in the CSV box to download it.

Download the CSV file as well.
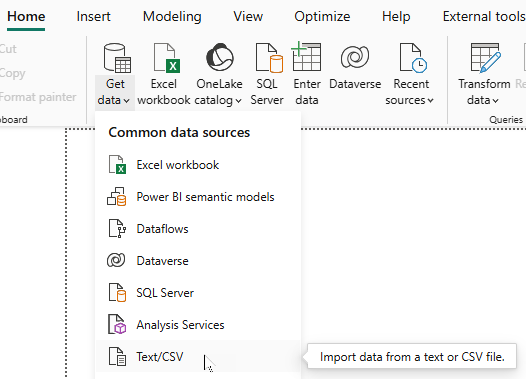
Back in Power BI, import the map data by choosing Home | Get data | Text/CSV from the ribbon.

Power BI supports a range of delimiters when importing from a text file.
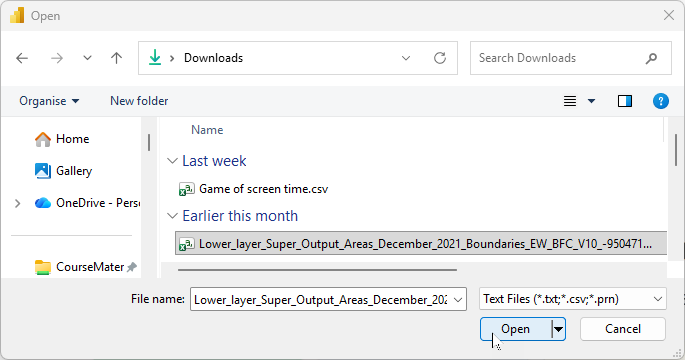
Choose the csv file you downloaded and click Open to import it.

Consider renaming your files to something a bit snappier!
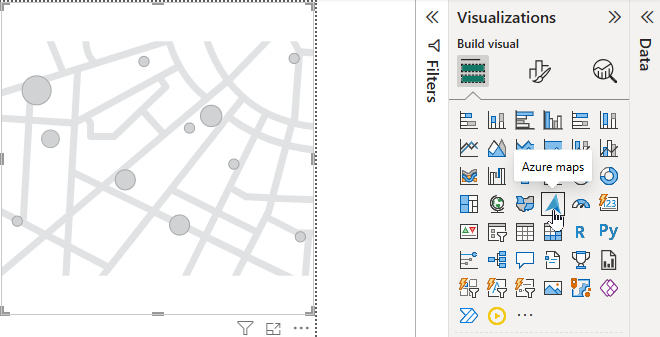
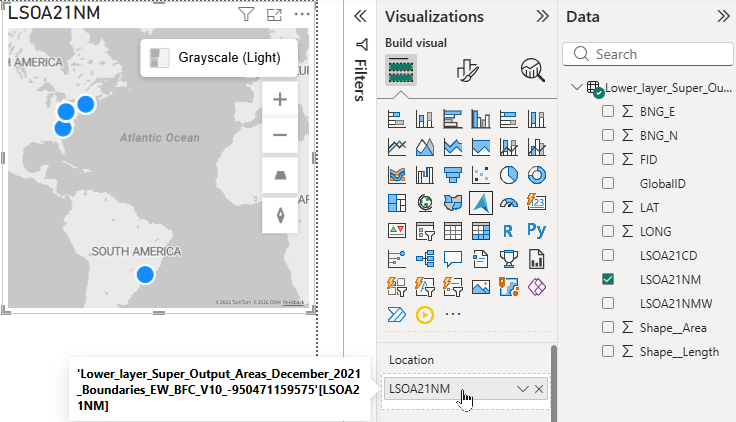
Next, create an Azure maps visual in Power BI.

Choose to insert an Azure maps visual.
Add the main column from the csv file into the visual. This will be the column containing the data in the csv data source and the zip file containing our reference layer.
Do not rename this in the Data pane, it must match the spatial file.

You can safely rename the column in the visual, as this is an alias.
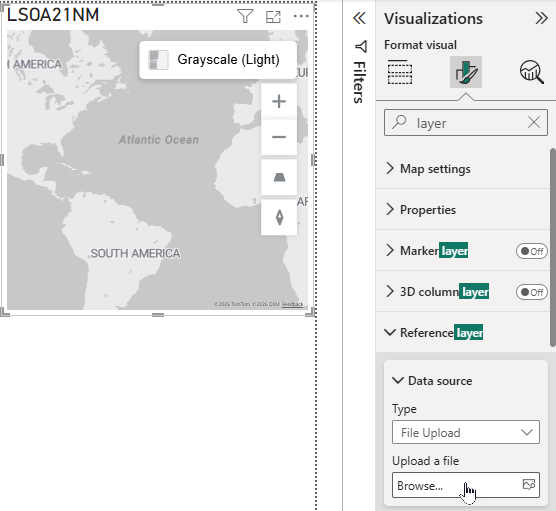
To add the reference layer to the map, in the Format visual pane, expand Reference layer | Data source | Upload a file and click Browse...

I've also toggled off the Marker layer. You can keep it on if you like but for this example I don't want it.
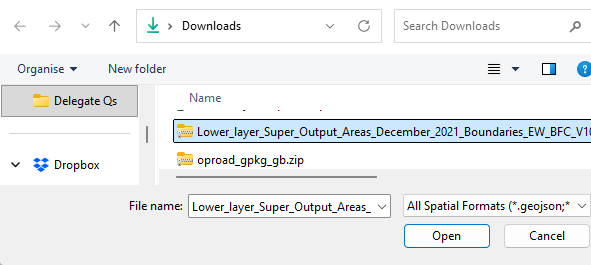
Choose the zipped ShapeFile we downloaded earlier and click Open.

Shapefiles will appear as ZIP files.
As long as the names in the CSV and Shapefiles match, after a few seconds the reference layers will render onto the map.

Now apply some formatting and enjoy the results.
Some other pages relevant to this blog include:
You can also book hourly online consultancy for your time zone with one of our 7 expert trainers!
Kingsmoor House
Railway Street
GLOSSOP
SK13 2AA
Elementa Workspace
6 Bevis Marks
LONDON
EC3A 7BA
c/o Holiday Inn
25 Aytoun Street
MANCHESTER
M1 3AE
© Wise Owl Business Solutions Ltd 2026. All Rights Reserved.