BLOGS BY TOPIC▼
BLOGS BY AUTHOR▼
BLOGS BY YEAR▼
Posted by Andy Brown on 03 October 2014
You need a minimum screen resolution of about 700 pixels width to see our blogs. This is because they contain diagrams and tables which would not be viewable easily on a mobile phone or small laptop. Please use a larger tablet, notebook or desktop computer, or change your screen resolution settings.
Copying Excel charts to Word using VBA, including textboxes
Inspired by a recent course question (thanks, Jen) I thought I'd share my thoughts on how to create a chart, add a textbox to it and copy the whole caboodle to Word - all using VBA.
You'll need to know some VBA to make sense of this blog, and obviously know Excel too. Note that you can download the file containing this code here.
What the example macro does
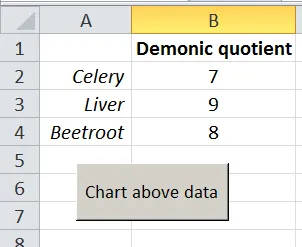
I don't like liver (who does?), but I wanted to compare this dislike scientifically against my dislike of other devil foods. The macro takes this worksheet:

A worksheet comparing 3 devil foods.
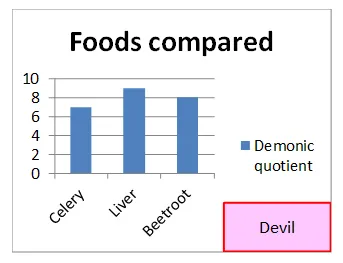
And uses this to create the following chart in Word:

The clever thing is that the textbox at the bottom right is part of the chart, and so is copied with it to Word.
Referencing the Word object library
The first thing that you need to do is to create a reference to Word, so that you can copy your Excel chart to Word at the end:

If you just want to create the chart in Excel, you can skip this step. You can see more on referencing other applications in VBA here.
Deleting any old charts
The first thing that the macro does is to get rid of any old charts on the worksheet:
Sub DeleteOldCharts()
'loop over all shapes, deleting the ones which are charts
Dim s As Shape
For Each s In ActiveSheet.Shapes
If s.Type = msoChart Then
s.Delete
End If
Next s
End Sub
This works because embedded charts on a worksheet are actually shapes - but shapes with a particular charty type!
Creating our chart
We can now write code to create our chart:
'make chart variable public
Dim c As Chart
Sub CreateChart()
Dim s As Shape
Dim r As Range
Dim tb As Shape
'first delete any old charts
DeleteOldCharts
'get the data to be charted
Set r = Range("A1").CurrentRegion
'create the new chart
Set s = ActiveSheet.Shapes.AddChart
Set c = s.Chart
I've made the variable c a public variable here, so that I can use it in more than one procedure.
What this does is to get a reference to the range to be charted (if you want to see what CurrentRegion does, click on cell A1 in the worksheet and press CTRL + A), then:
- Adds a new chart (as a shape, naturally), and at the same time sets the variable called s to refer to this new shape.
- Sets the variable c to refer to the shape as a chart, rather than just a shape.
If you think the above doesn't make much sense, you're not the only one!
Customising the chart
The first thing we'll do now is to say what data we're charting:
'set what its charting, and make it a column chart
c.ChartType = xlColumnClustered
c.SetSourceData Source:=r
'add a title
c.ChartTitle.Text = "Foods compared"
Here we make this a column chart, to chart the block of cells containing the devil foods, and give it a suitable title. Next, we'll give the chart a name so that we can refer to it later:
'give it a name (could also use s.Name = "DevilFoods")
'note that the "parent" is the shape the chart sits on
c.Parent.Name = "DevilFoods"
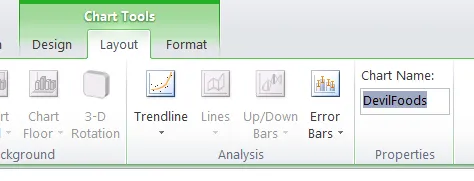
This is equivalent to typing a name in here:

This shows that the chart has been successfully named.
I then moved the chart so that it "began" at the top left corner of cell C5:
'move the chart to align with the top edge of cell C5
s.Left = Range("C5").Left
s.Top = Range("C5").Top
'make it 4 times wider and 10 times higher than C5
s.Width = Range("C5").Width * 4
s.Height = Range("C5").Height * 10
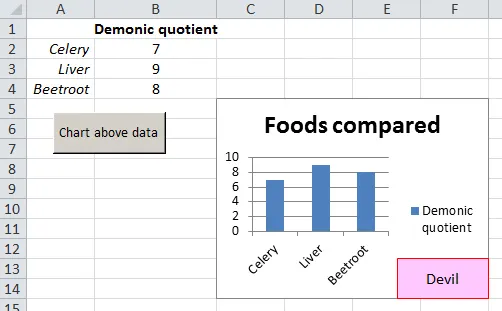
The chart is four times wider than this cell, and ten times higher:

This diagram shows where the chart will end up.
Adding a textbox to the chart
I know want to add the text box shown above. The critiical thing is to add it into the collection of shapes contained within the chart, rather than as a separate shape on the worksheet.
The reason for this is that when you copy the chart you will also copy (obviously) any shapes that it contains - including your textbox.
Here's the code to add the textbox:
'now we need to add a text box to it at the bottom
'right corner
Set tb = c.Shapes.AddTextbox( _
Orientation:=msoTextOrientationHorizontal, _
Left:=2 * s.Width / 3, _
Top:=4 * s.Height / 5, _
Width:=s.Width / 3, _
Height:=s.Height / 5)
tb.TextFrame.Characters.Text = "Devil"
It's positioned:
- two-thirds of the distance in from the left of the chart; and
- four-fifths of the way down from the top of the chart
The width and height are set to make it align with the bottom right corner of the chart. Just for fun, I formatted it a bit:
'format this
tb.Fill.BackColor.RGB = RGB(255, 200, 255)
tb.Line.Weight = 1
tb.Line.ForeColor.RGB = RGB(255, 0, 0)
tb.TextFrame.VerticalAlignment = xlVAlignCenter
tb.TextFrame.HorizontalAlignment = xlHAlignCenter
Hopefully it's reasonably obvious what the lines above do.
Copying the chart to Word
The final part of the macro calls a separate routine to copy the chart to Word:
'now copy this to Word
CopyChartToWord
End Sub
Here is that routine (as I mentioned above, you'll need to have referenced Word for this to work):
Sub CopyChartToWord()
'copy this chart
c.Parent.Copy
'paste in new Word document
Dim wd As New Word.Application
Dim doc As Word.Document
Set doc = wd.Documents.Add
wd.Visible = True
wd.Selection.PasteSpecial _
Link:=False, _
DataType:=wdPasteEnhancedMetafile, _
Placement:=wdInLine, _
DisplayAsIcon:=False
End Sub
Note that the VBA code copies the chart's parent shape, not the chart itself. And that's it!